|
Size: 662
Comment:
|
Size: 1582
Comment:
|
| Deletions are marked like this. | Additions are marked like this. |
| Line 1: | Line 1: |
| === Coupling plot tool === | == Coupling plot tool == |
| Line 3: | Line 3: |
| === Tool direction === {{{ [detchar@k1det1 ~]$ cd gwpy-tools/kagra_coupling_plot/ [detchar@k1det1 kagra_coupling_plot]$ ls kagra_coupling_plot.py plot run_plot.sh }}} === How to use === The run_plot.sh file contains usage examples and argument explanations. {{{ [detchar@k1det1 kagra_coupling_plot]$ cat run_plot.sh python kagra_coupling_plot.py -ach K1:VIS-EY_TM_OPLEV_SUM_OUT_DQ -bch K1:LSC-MICH_CTRL_CAL_OUT_DQ -s 1145621548.0 -d 600 -a 100 -f 103.5 -p 1 ## [1] -ach :: Enter first channel name to compare ## [2] -bch :: Enter second channel name to compare ## [3] -s :: Enter start GPS time ## [4] -d :: Enter time from star GPS time ## [5] -a :: Averaging Number ## [6] -f :: Enter frequency to obtain amplitude value ## [7] -p :: Enter 0 or 1 to determine whether to save the plot. 0 or None is not drawn. 1 is saved. }}} === Slide === |
Coupling plot tool
Tool direction
[detchar@k1det1 ~]$ cd gwpy-tools/kagra_coupling_plot/
[detchar@k1det1 kagra_coupling_plot]$ ls
kagra_coupling_plot.py  plot  run_plot.sh
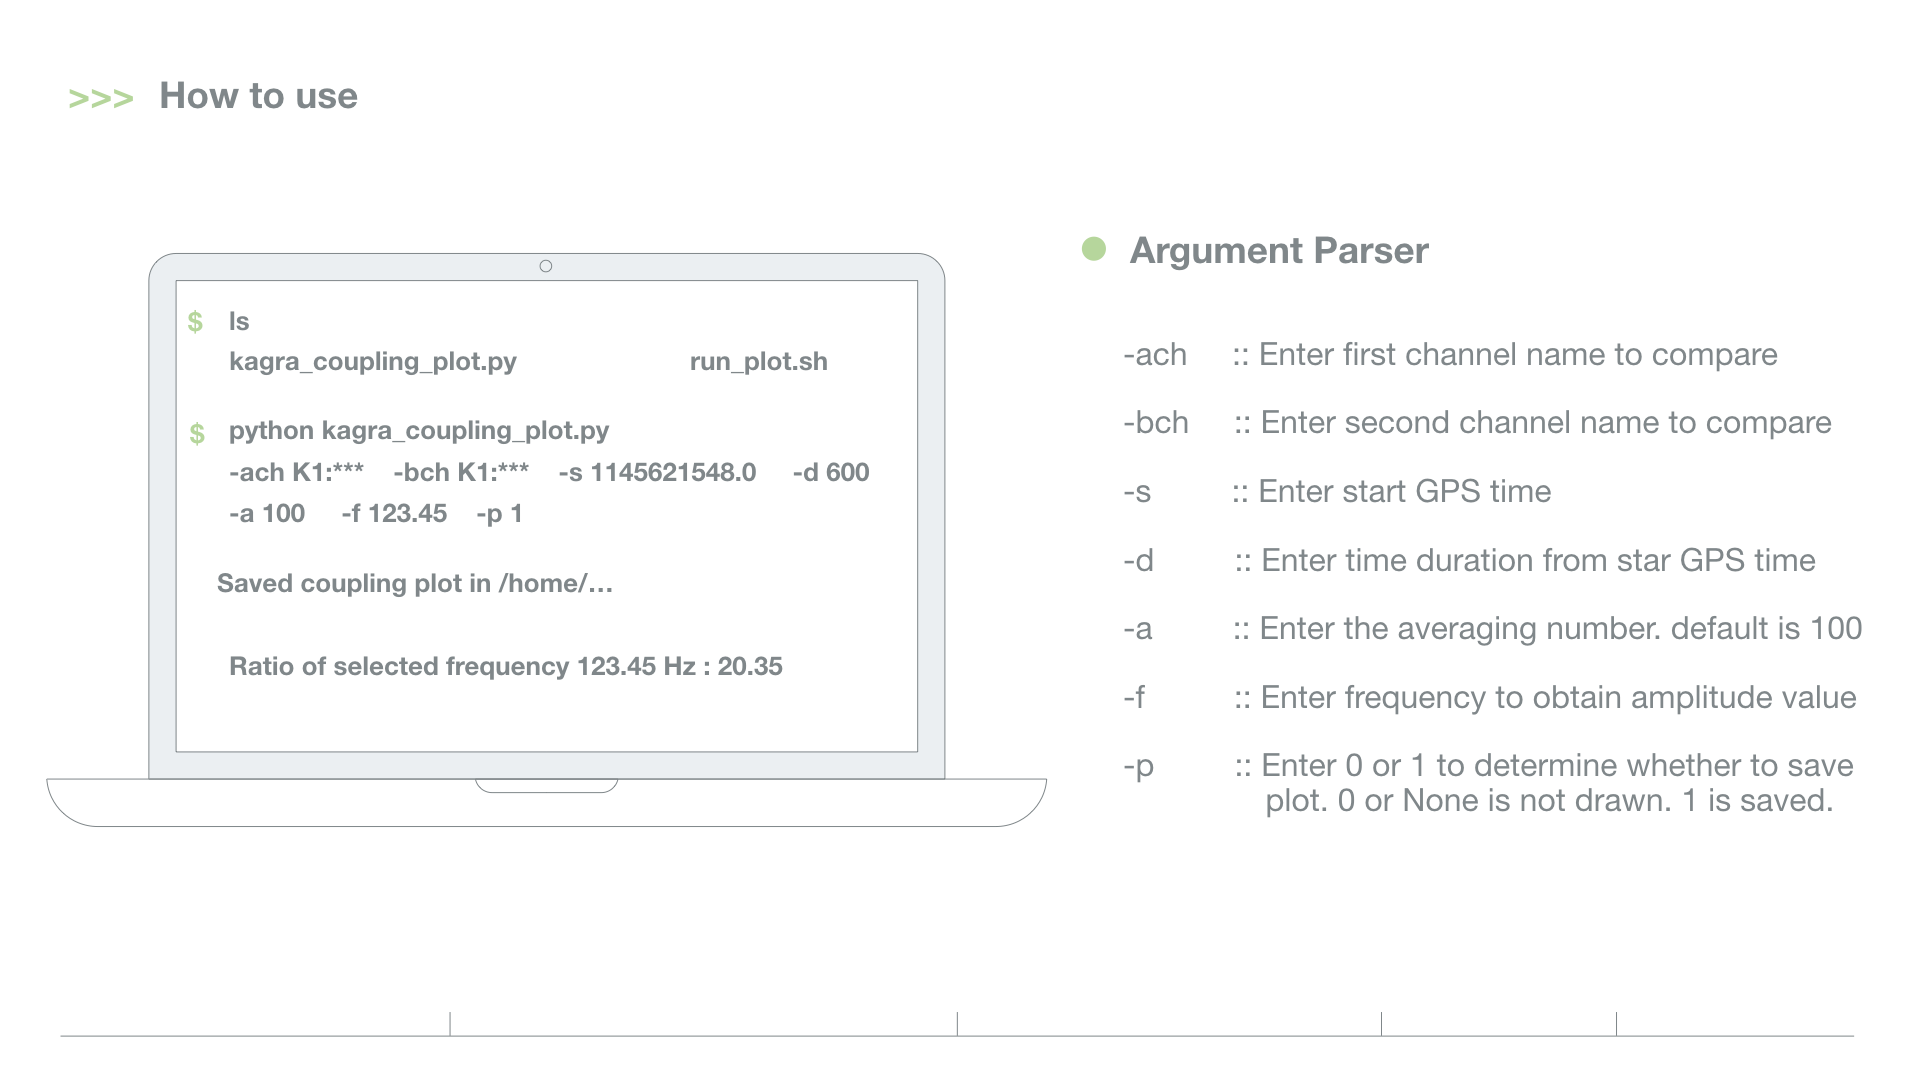
How to use
The run_plot.sh file contains usage examples and argument explanations.
[detchar@k1det1 kagra_coupling_plot]$ cat run_plot.sh

python kagra_coupling_plot.py -ach K1:VIS-EY_TM_OPLEV_SUM_OUT_DQ -bch K1:LSC-MICH_CTRL_CAL_OUT_DQ -s 1145621548.0 -d 600 -a 100 -f 103.5 -p 1

## [1] -ach     :: Enter first channel name to compare
## [2] -bch     :: Enter second channel name to compare
## [3] -s       :: Enter start GPS time
## [4] -d       :: Enter time from star GPS time
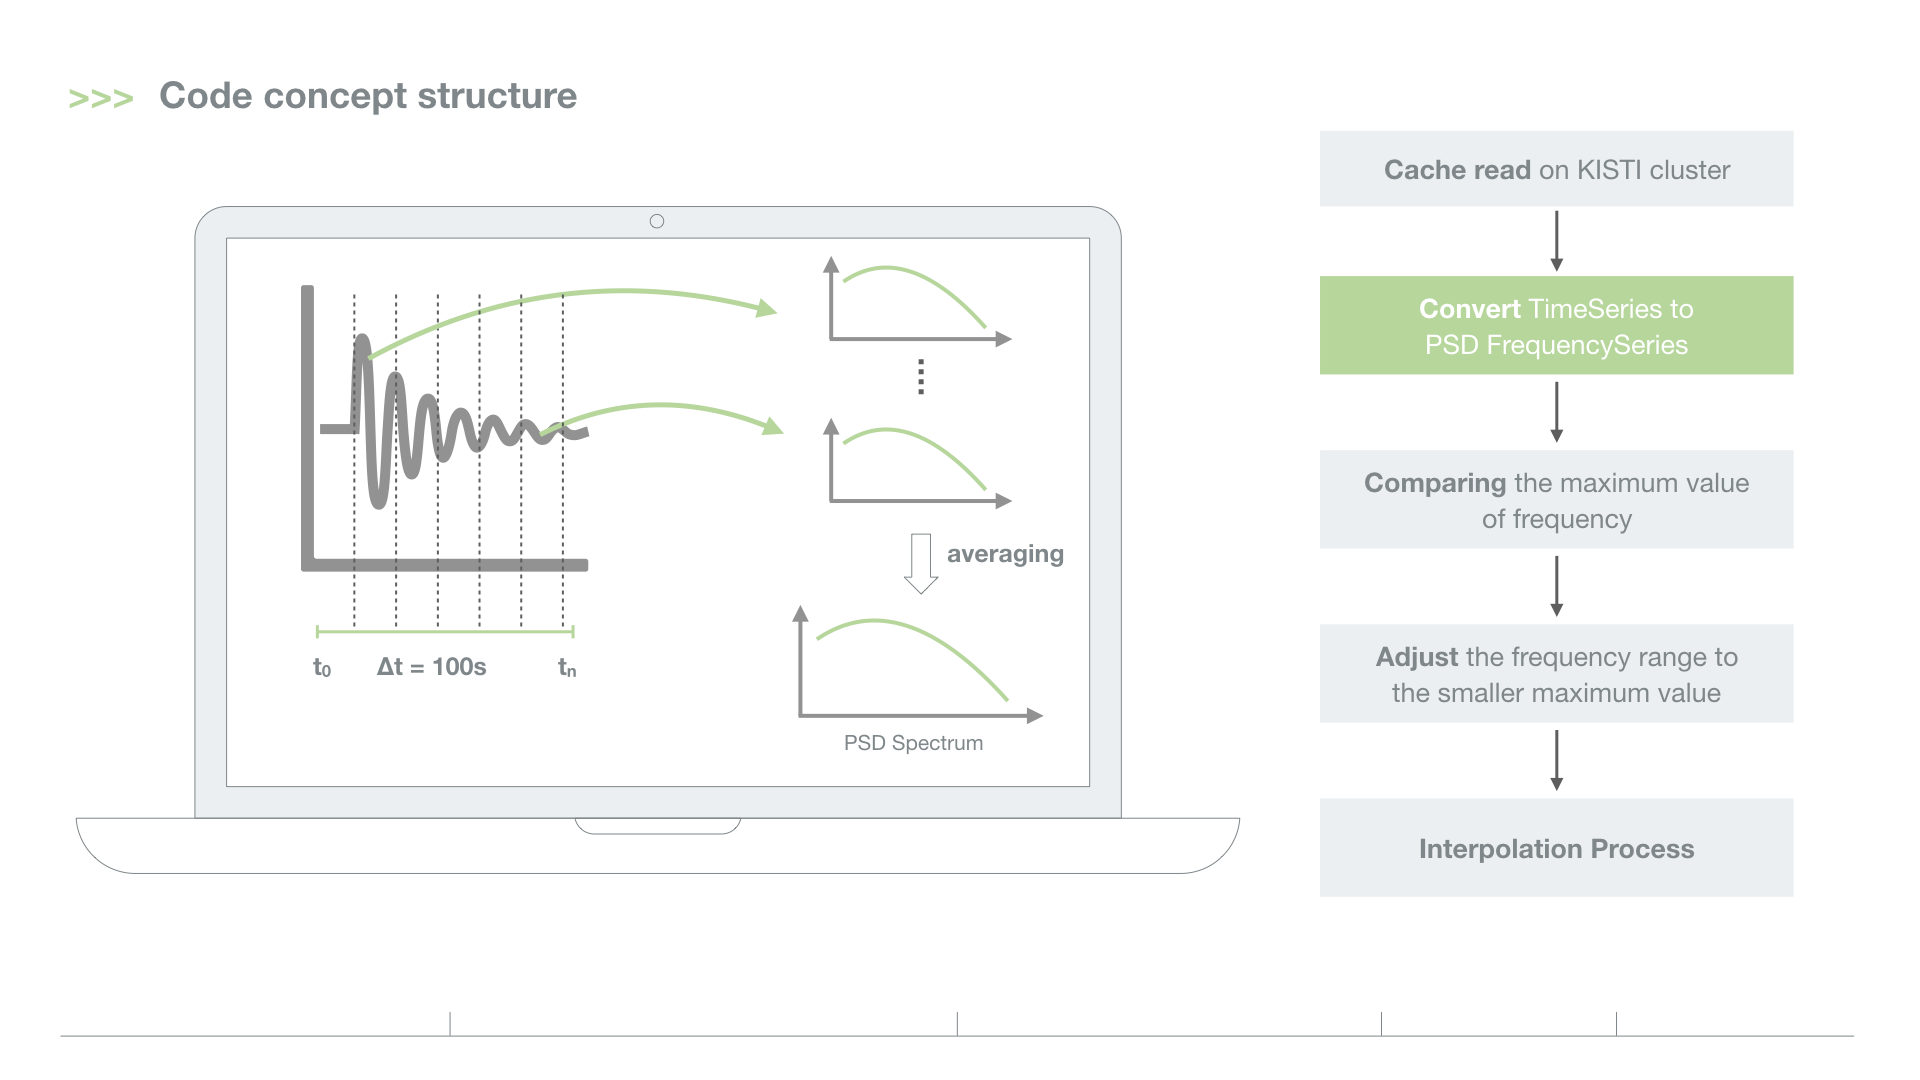
## [5] -a       :: Averaging Number
## [6] -f       :: Enter frequency to obtain amplitude value
## [7] -p       :: Enter 0 or 1 to determine whether to save the plot. 0 or None is not drawn. 1 is saved.
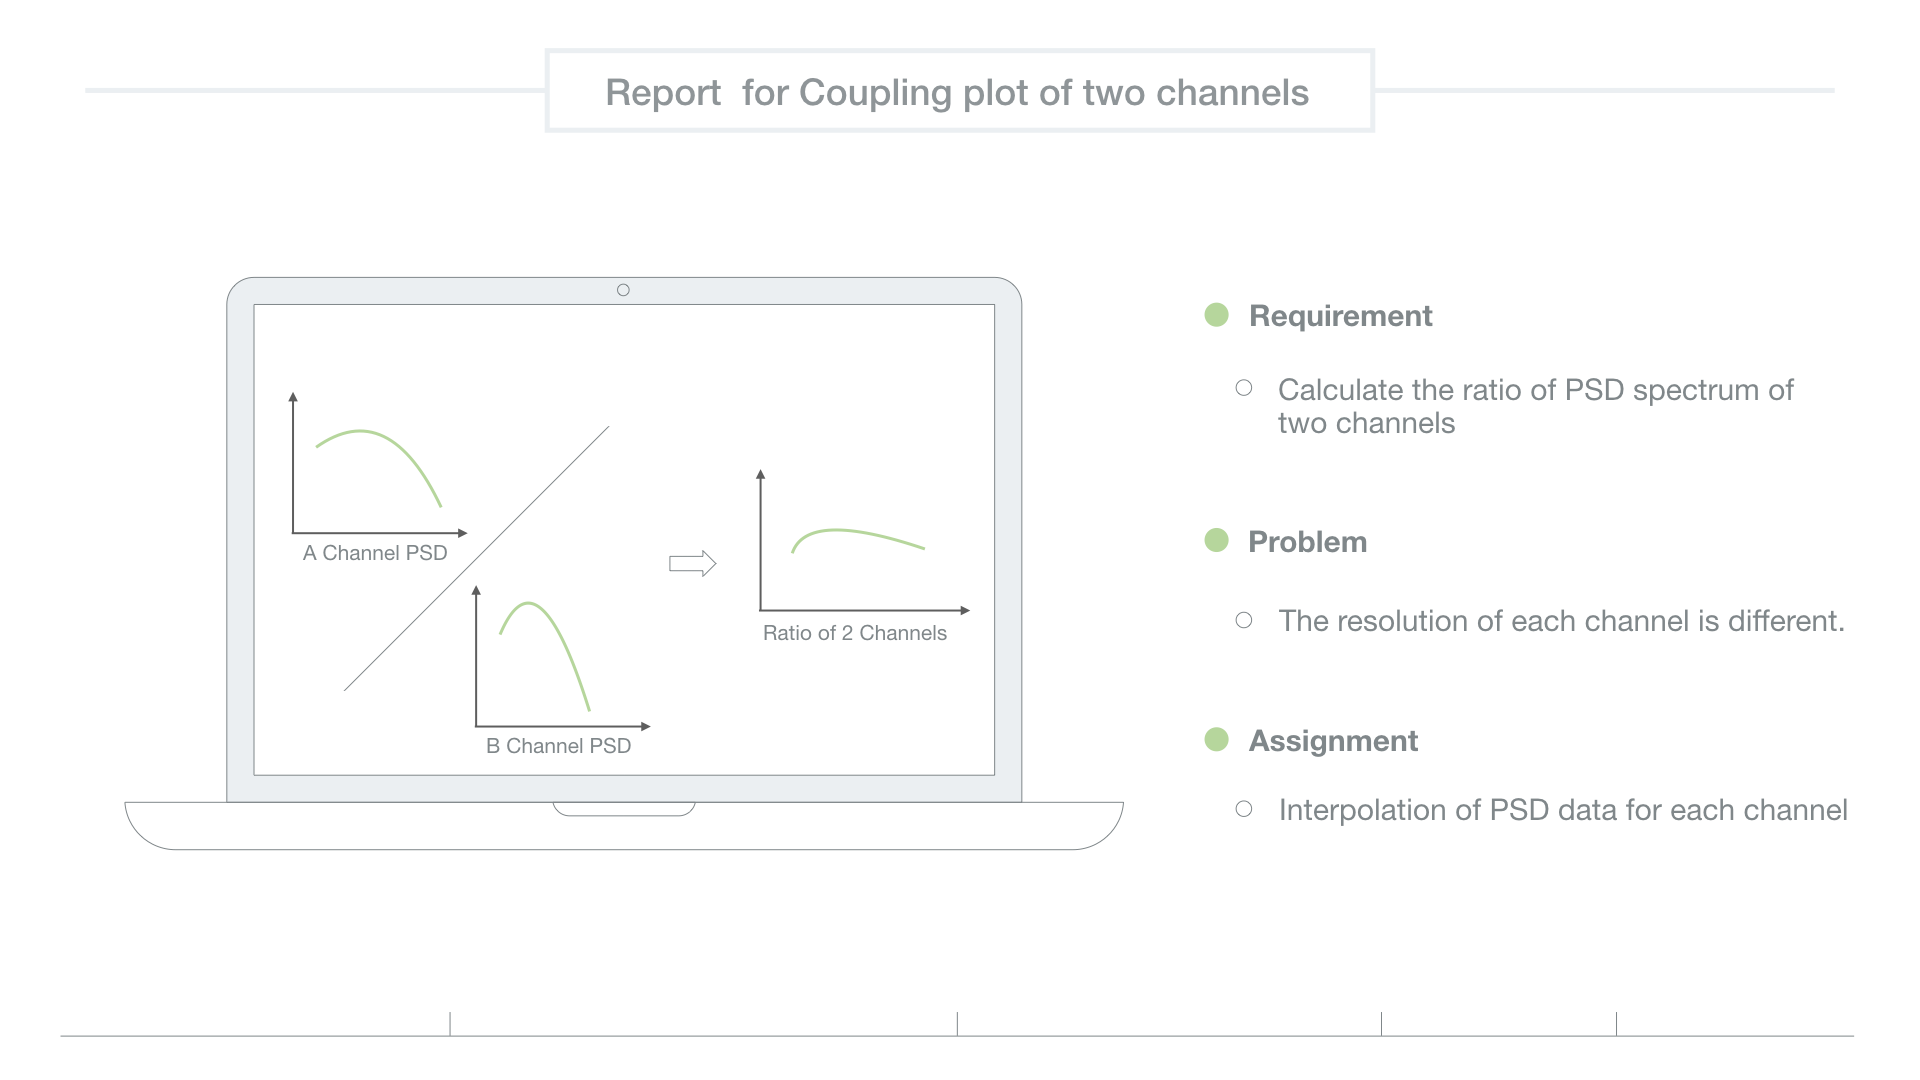
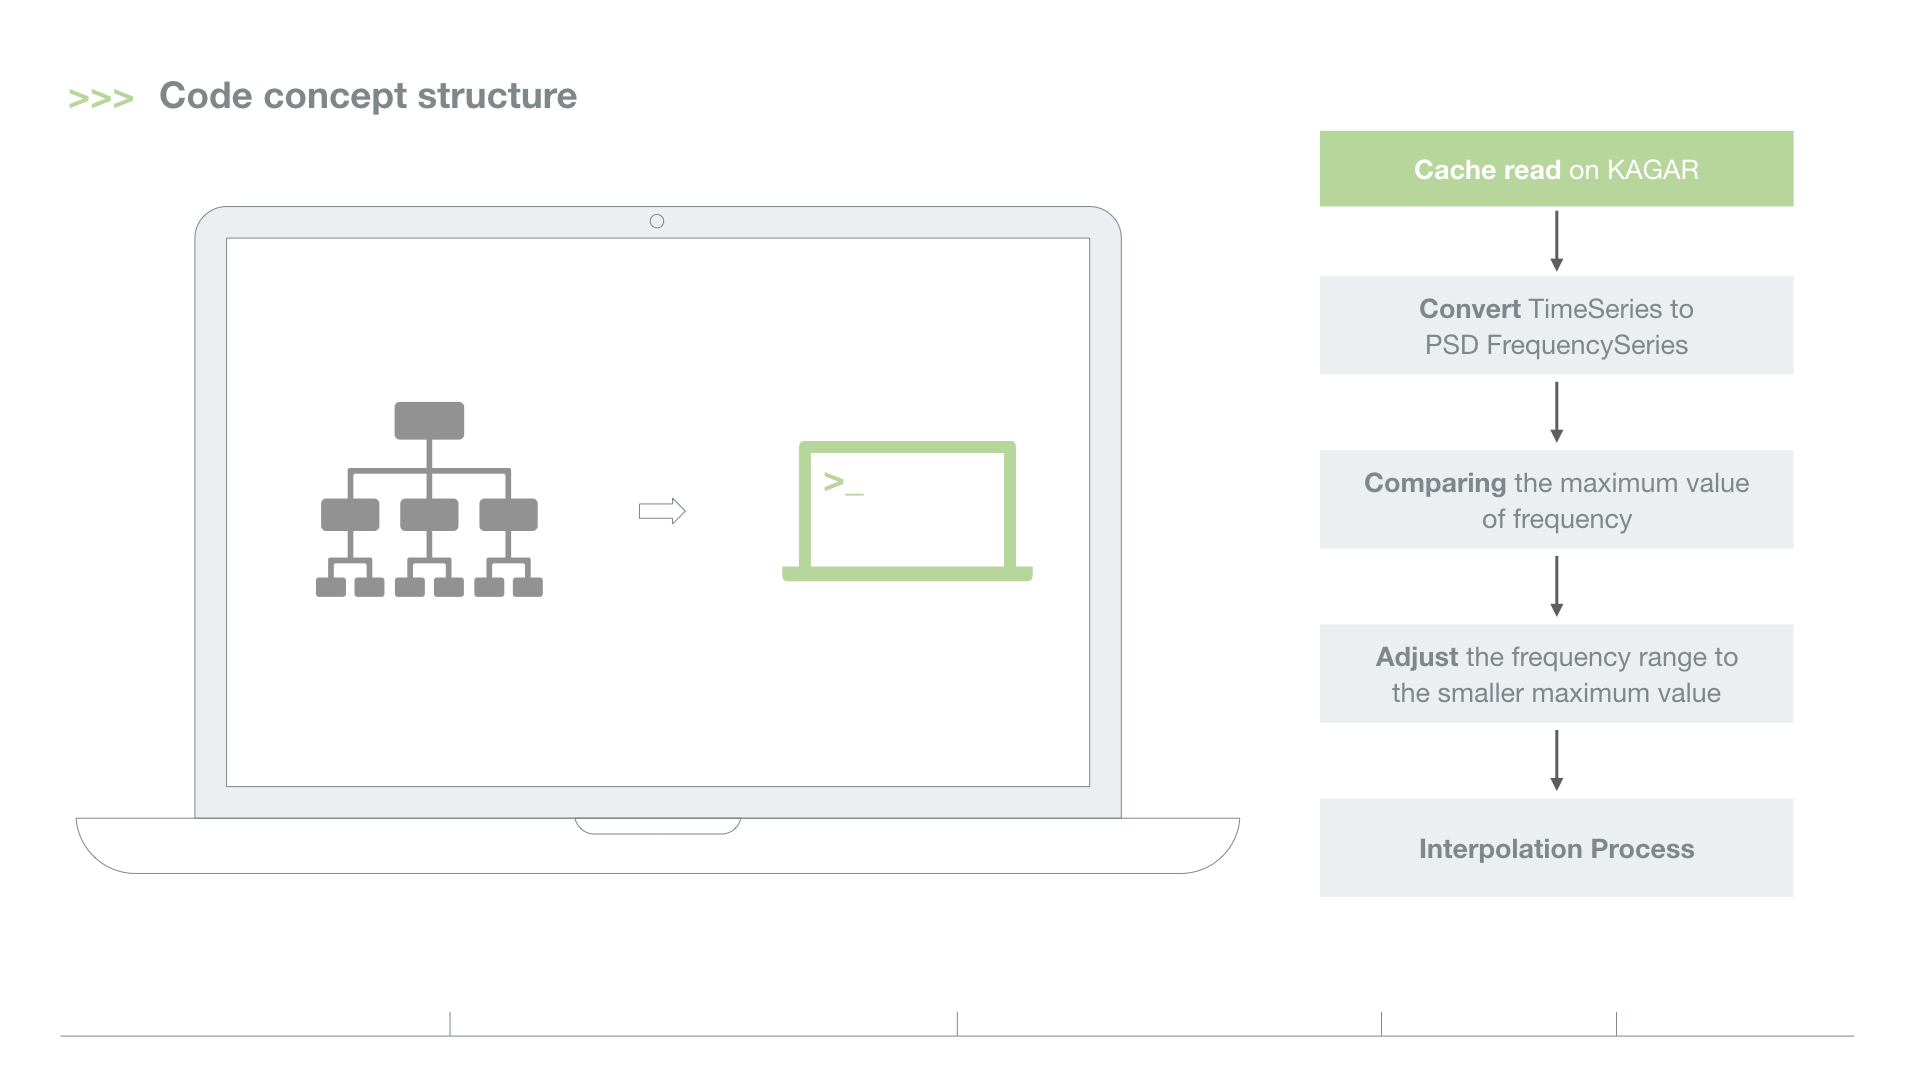
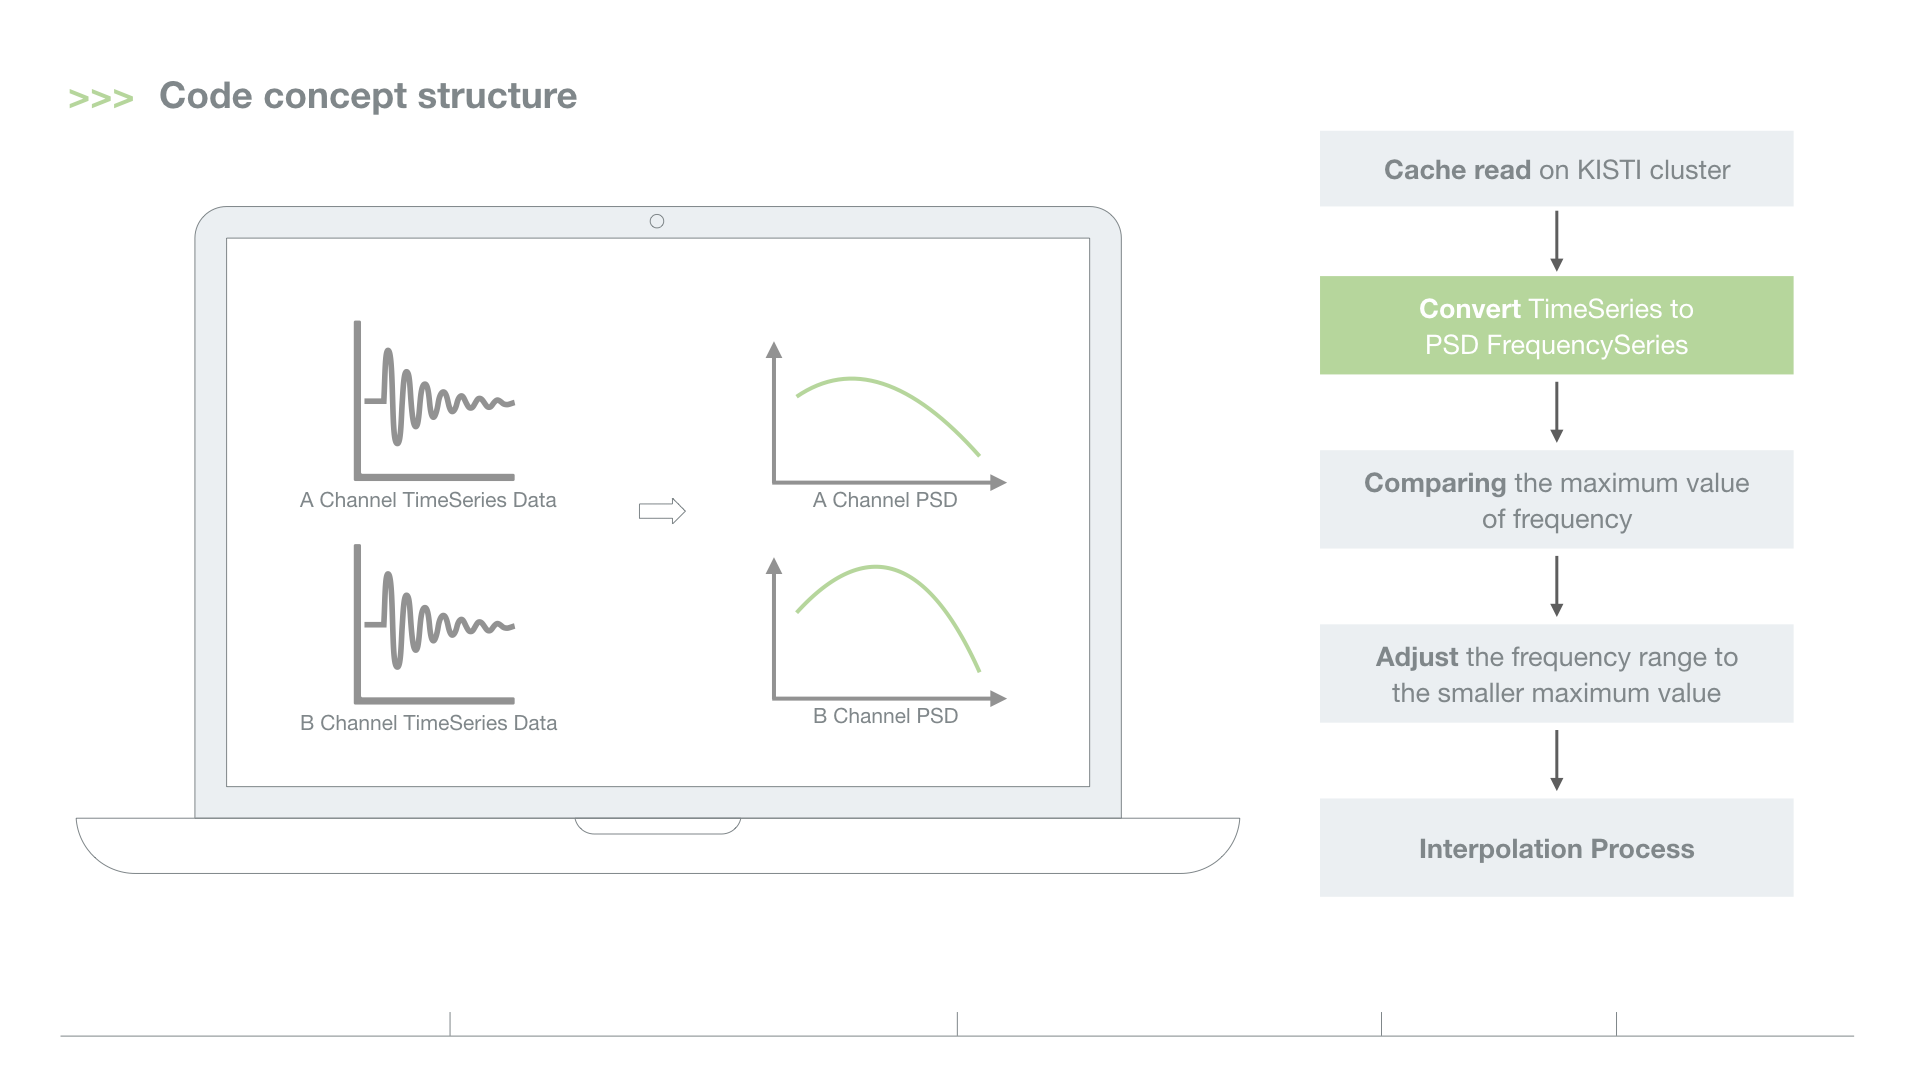
Slide
