Coupling plot tool
Tool direction
- In k1det1
[detchar@k1det1 ~]$ cd /home/detchar/gwpy-tools/kagra_coupling_plot/
[detchar@k1det1 kagra_coupling_plot]$ ls
kagra_coupling_plot.py  plot  run_plot.sh
- In seikai
[user@seikai ~]$ cd /home/detcha/gwpy-tools/kagra_coupling_plot/
[user@seikai kagra_coupling_plot]$ ls
kagra_coupling_plot.py  plot  run_plot.sh
How to use
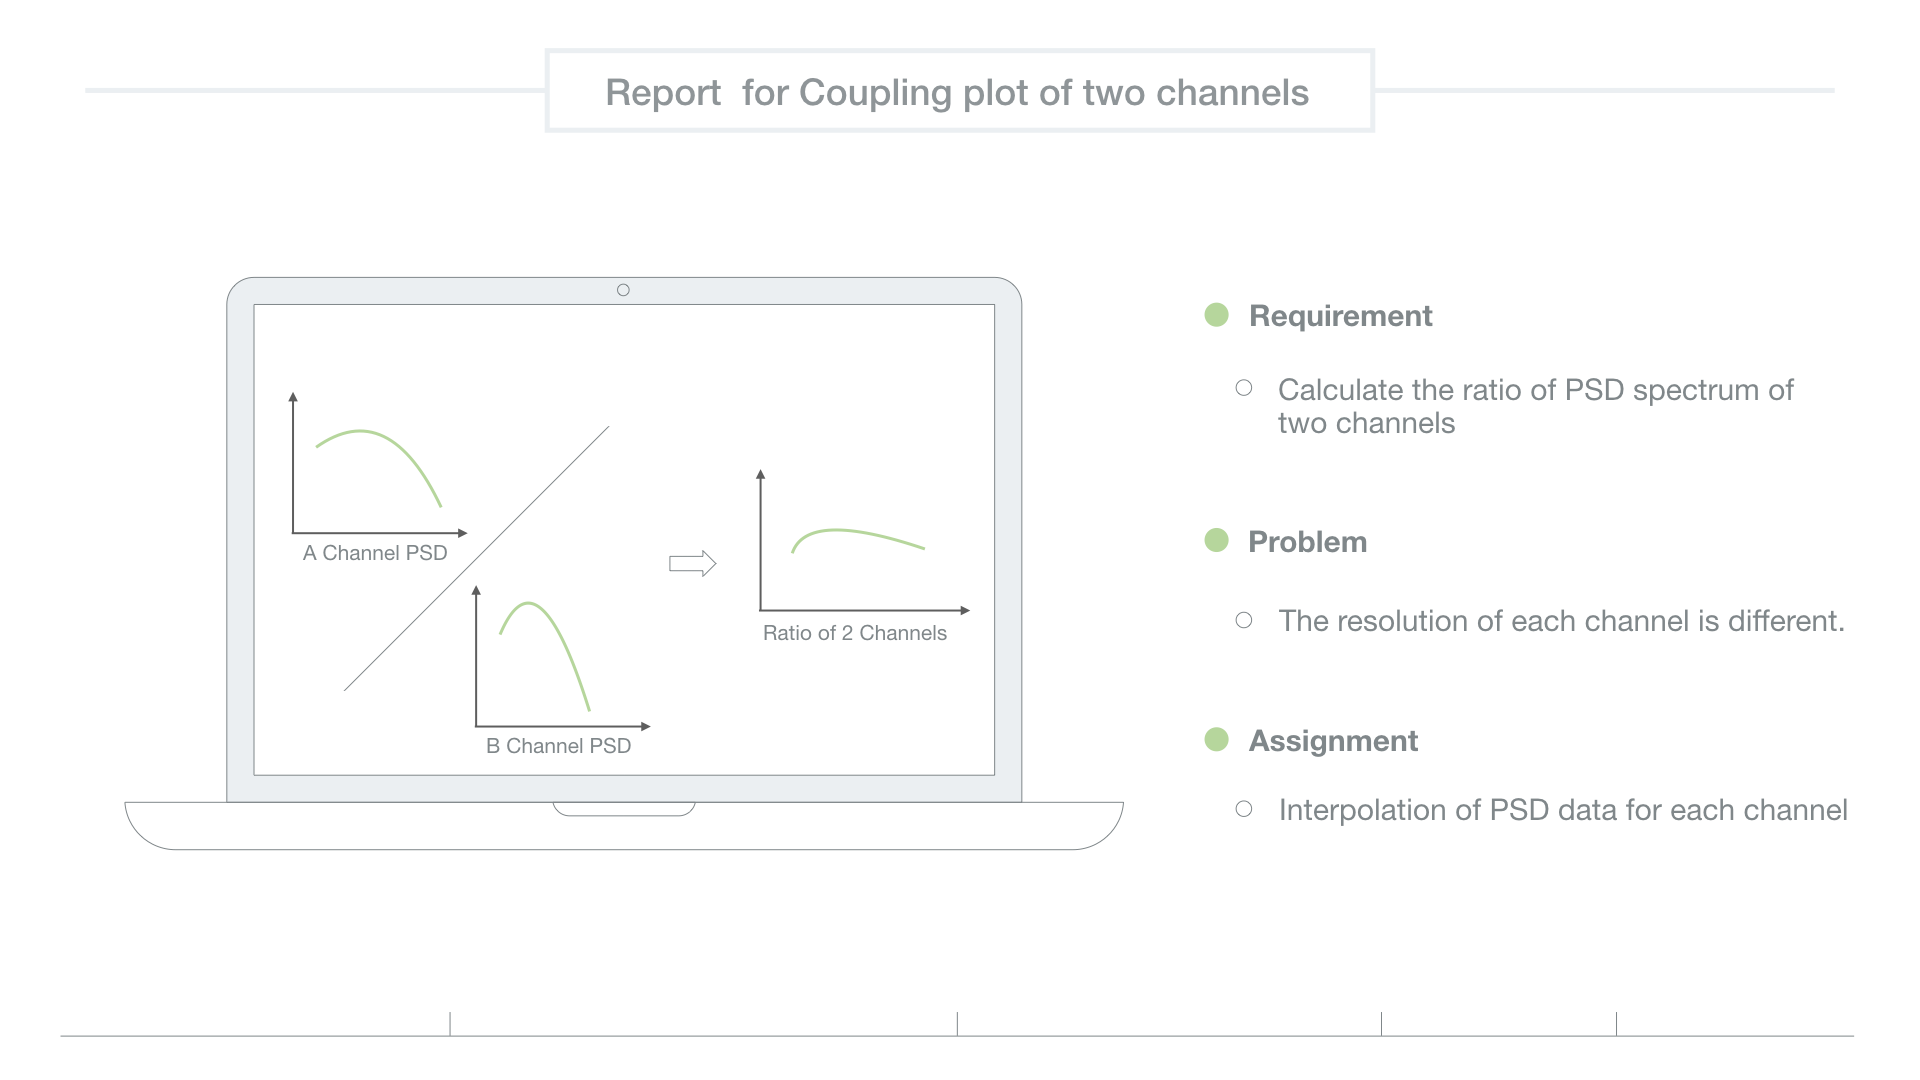
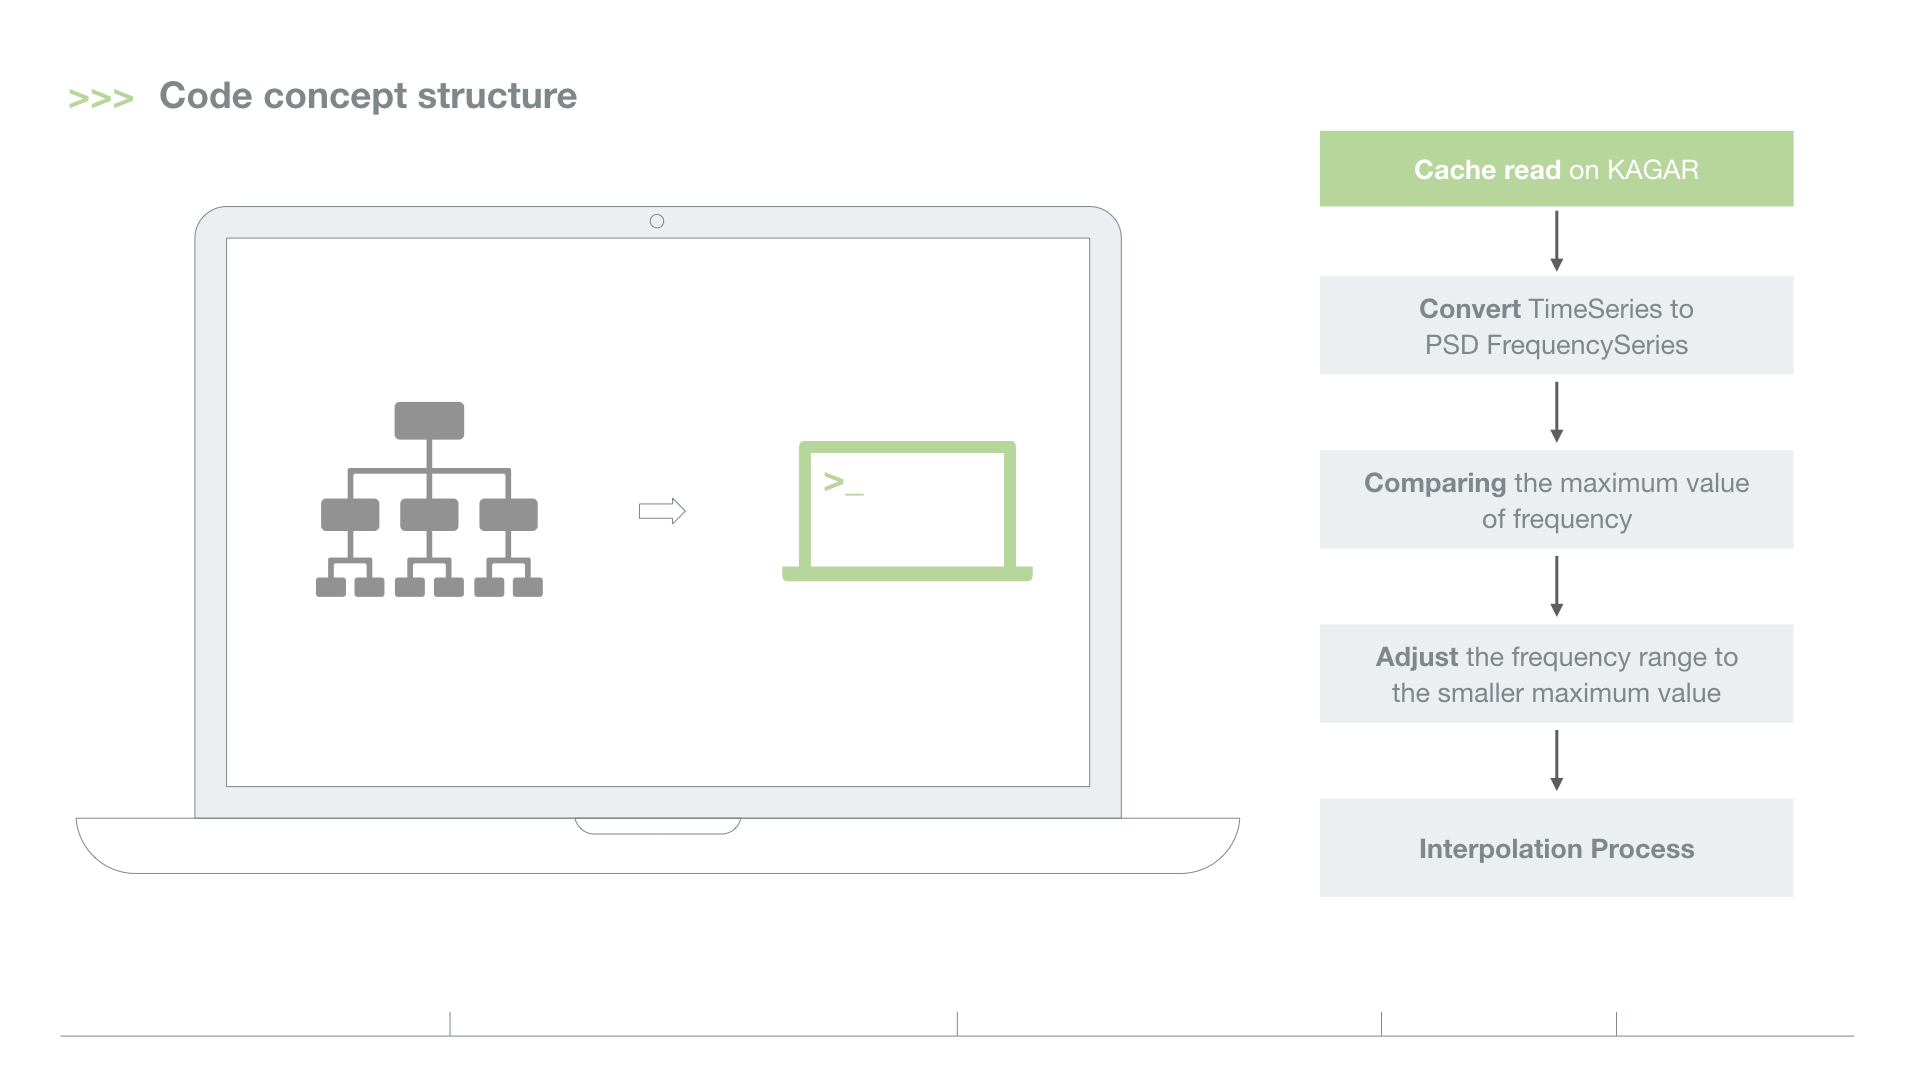
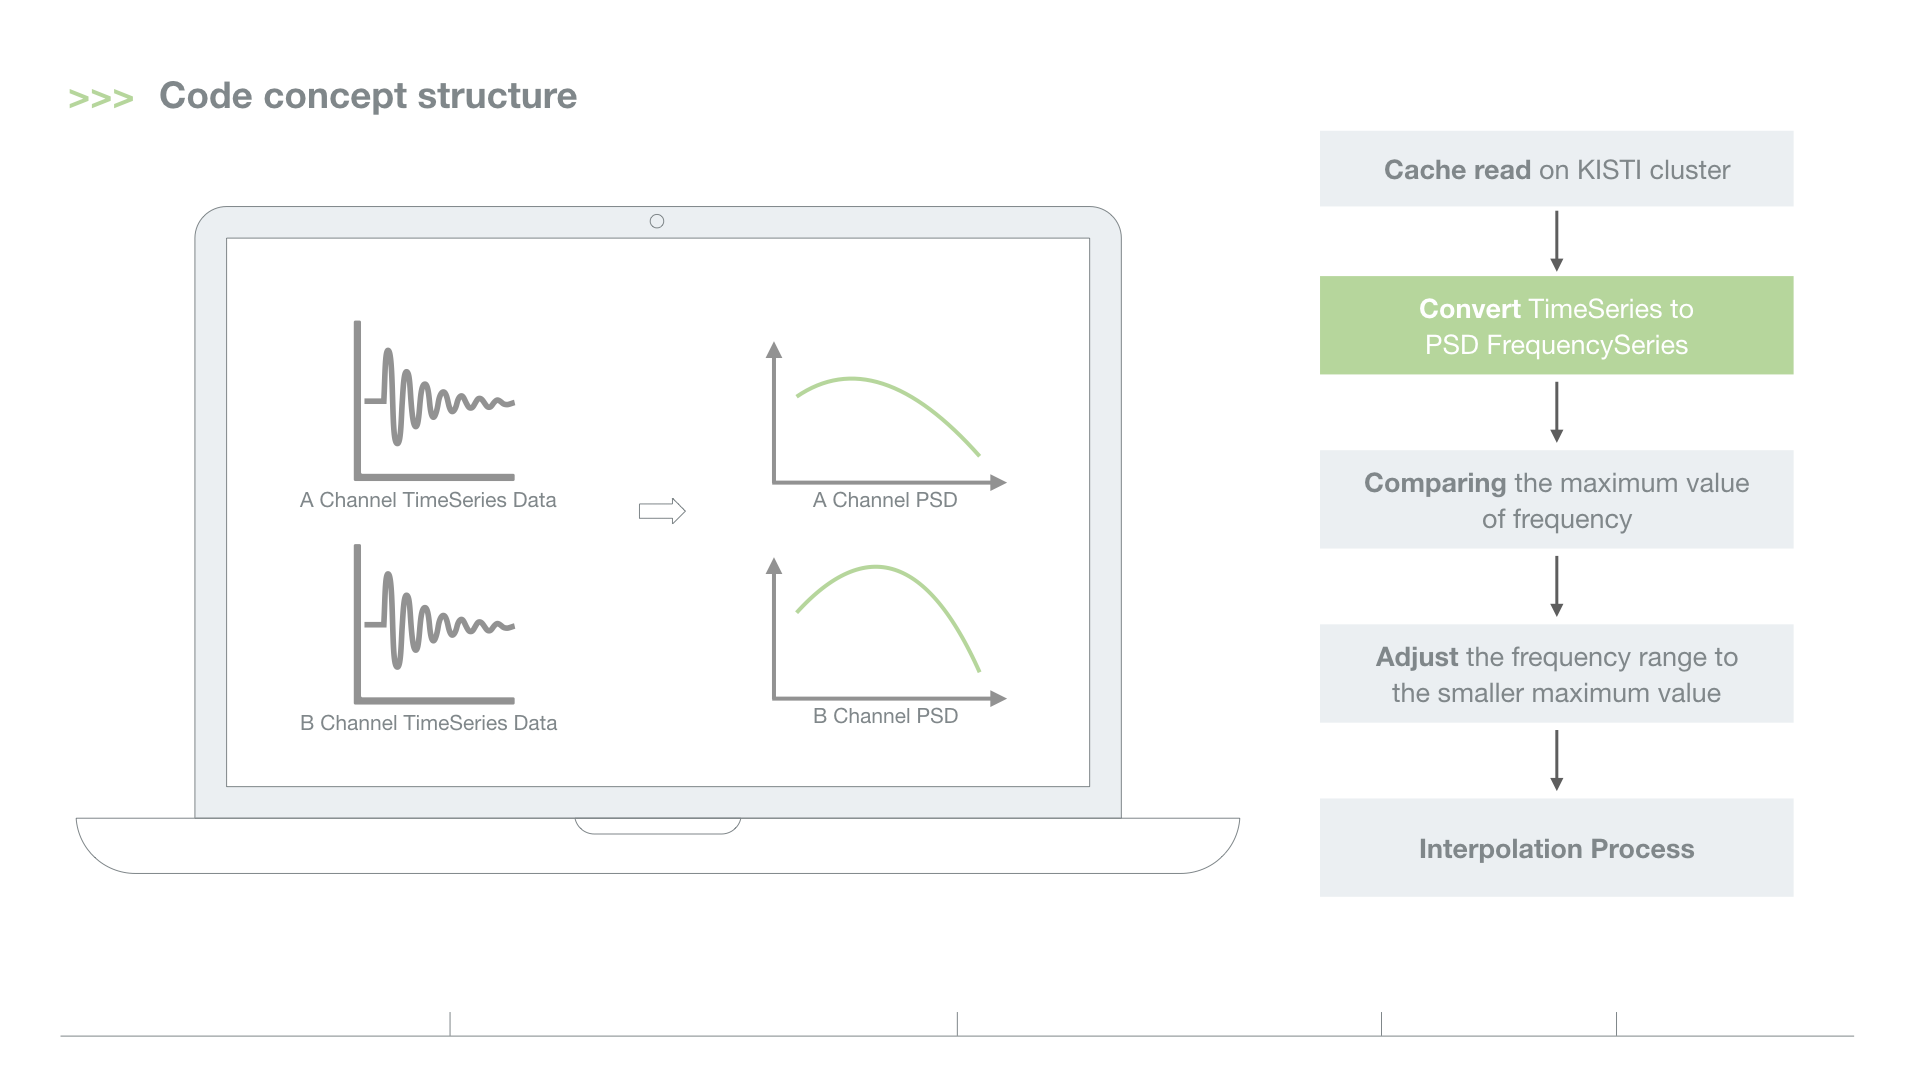
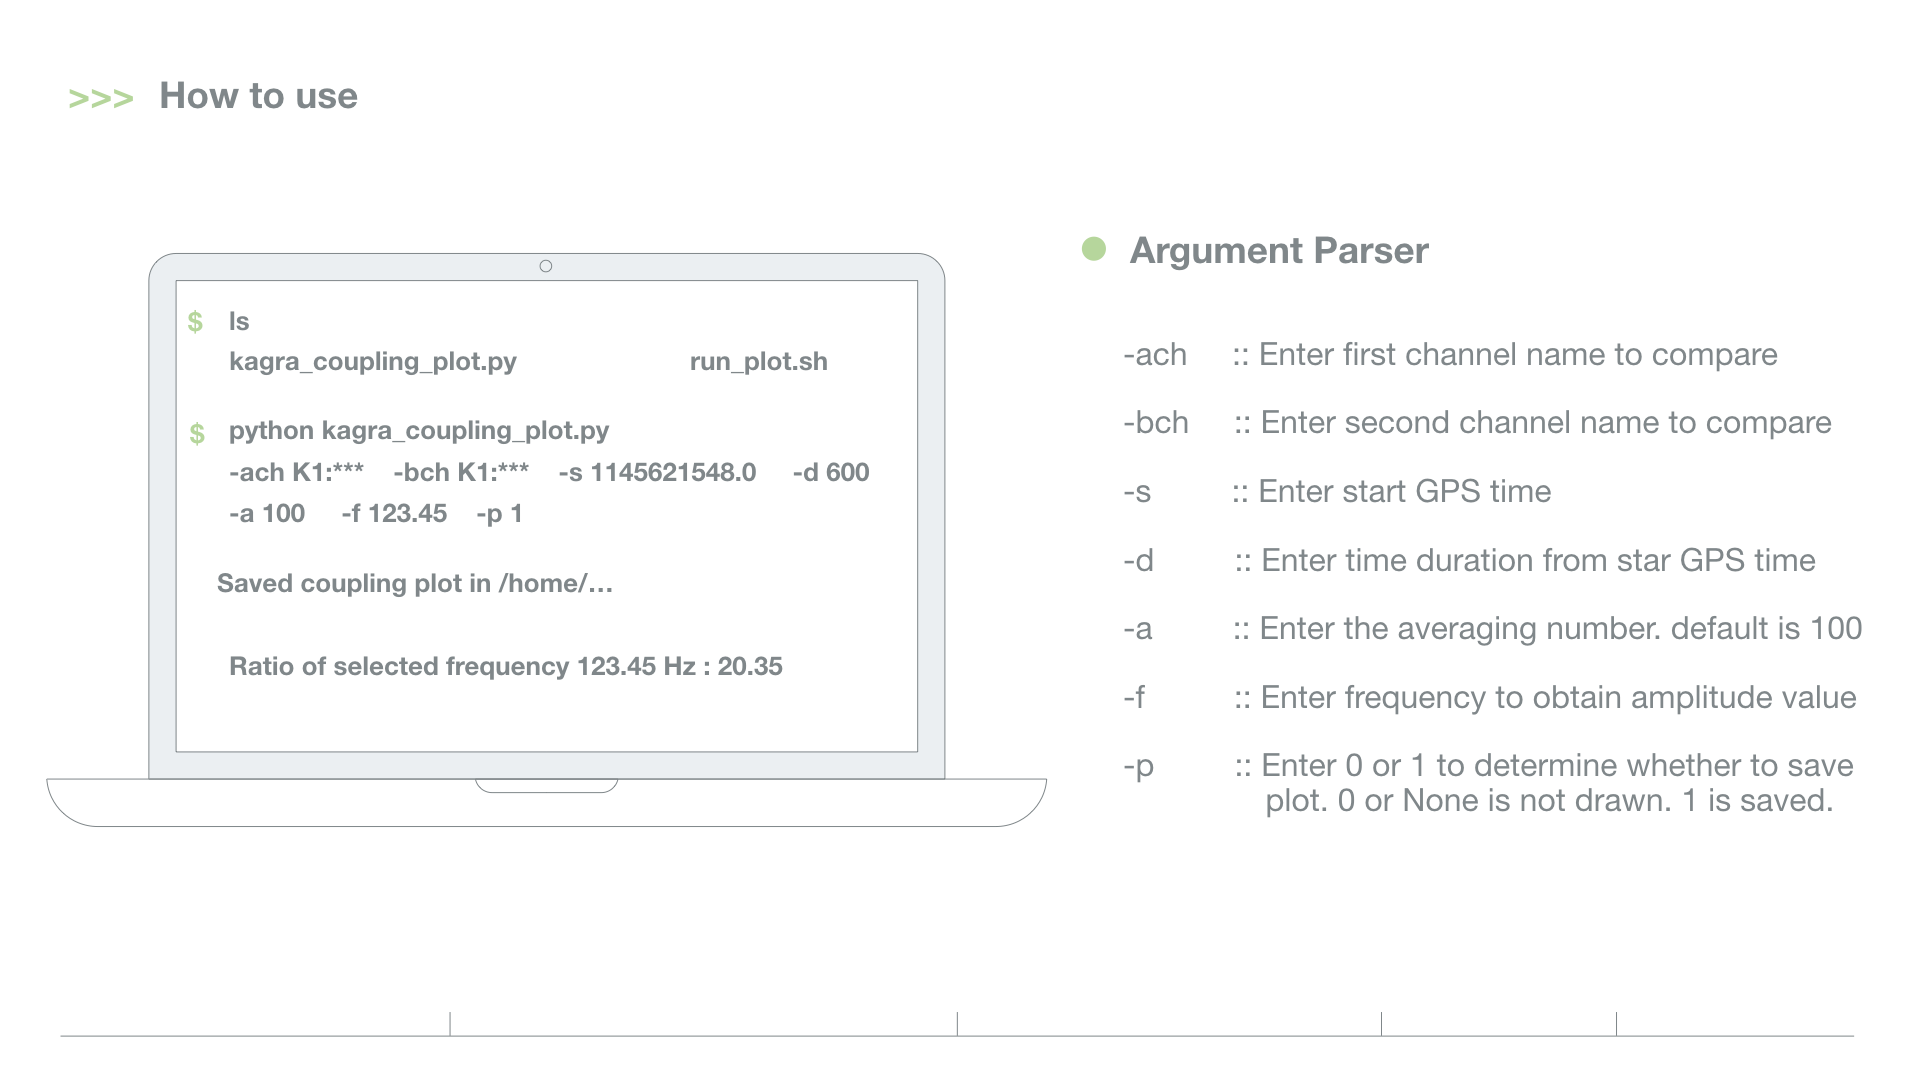
The run_plot.sh file contains usage examples and argument explanations.
[detchar@k1det1 kagra_coupling_plot]$ cat run_plot.sh

python kagra_coupling_plot.py -ach K1:VIS-EY_TM_OPLEV_SUM_OUT_DQ -bch K1:LSC-MICH_CTRL_CAL_OUT_DQ -s 1145621548.0 -d 600 -a 100 -f 103.5 -p 1

## [1] -ach     :: Enter first channel name to compare
## [2] -bch     :: Enter second channel name to compare
## [3] -s       :: Enter start GPS time
## [4] -d       :: Enter time from star GPS time duration
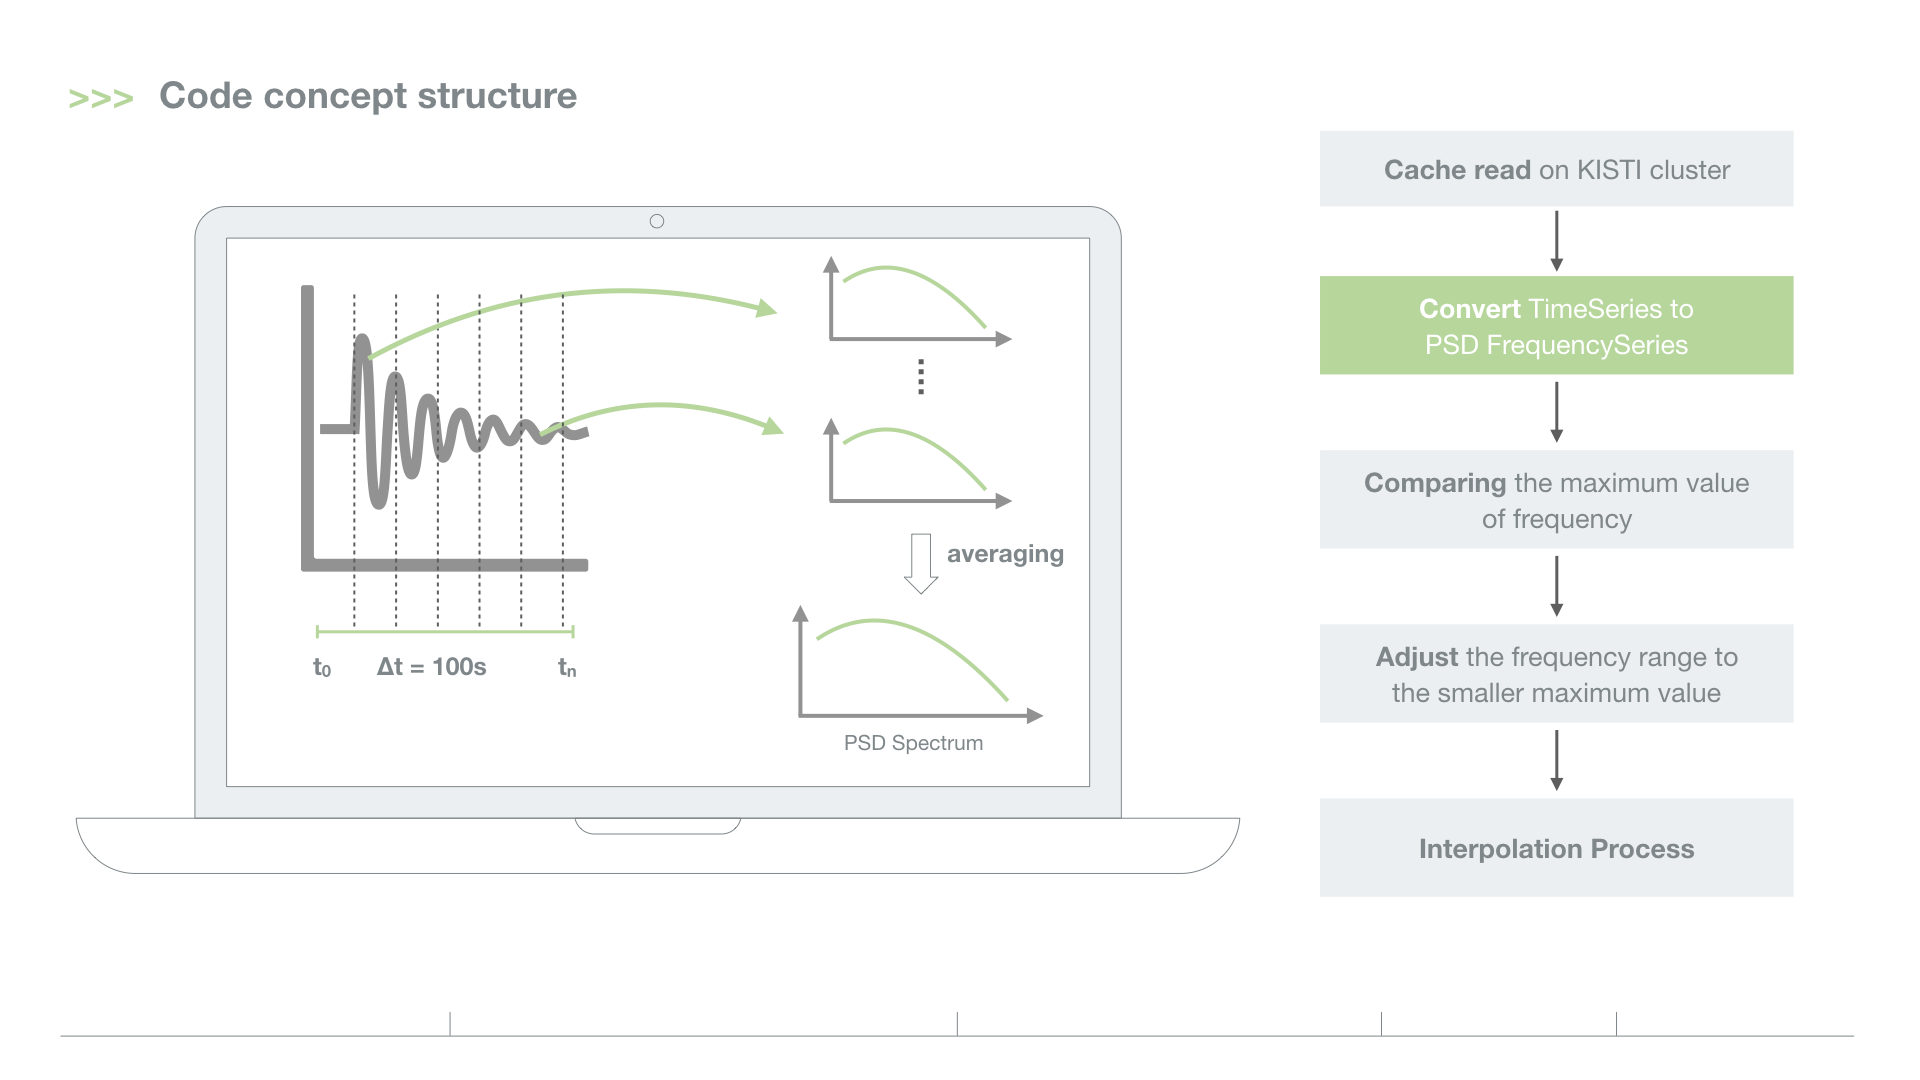
## [5] -a       :: Averaging Number. default avg. is 100.
## [6] -f       :: Enter frequency to obtain amplitude value
## [7] -p       :: Enter 0 or 1 to determine whether to save the plot. 0 or None is not drawn. 1 is saved.
and When you run,
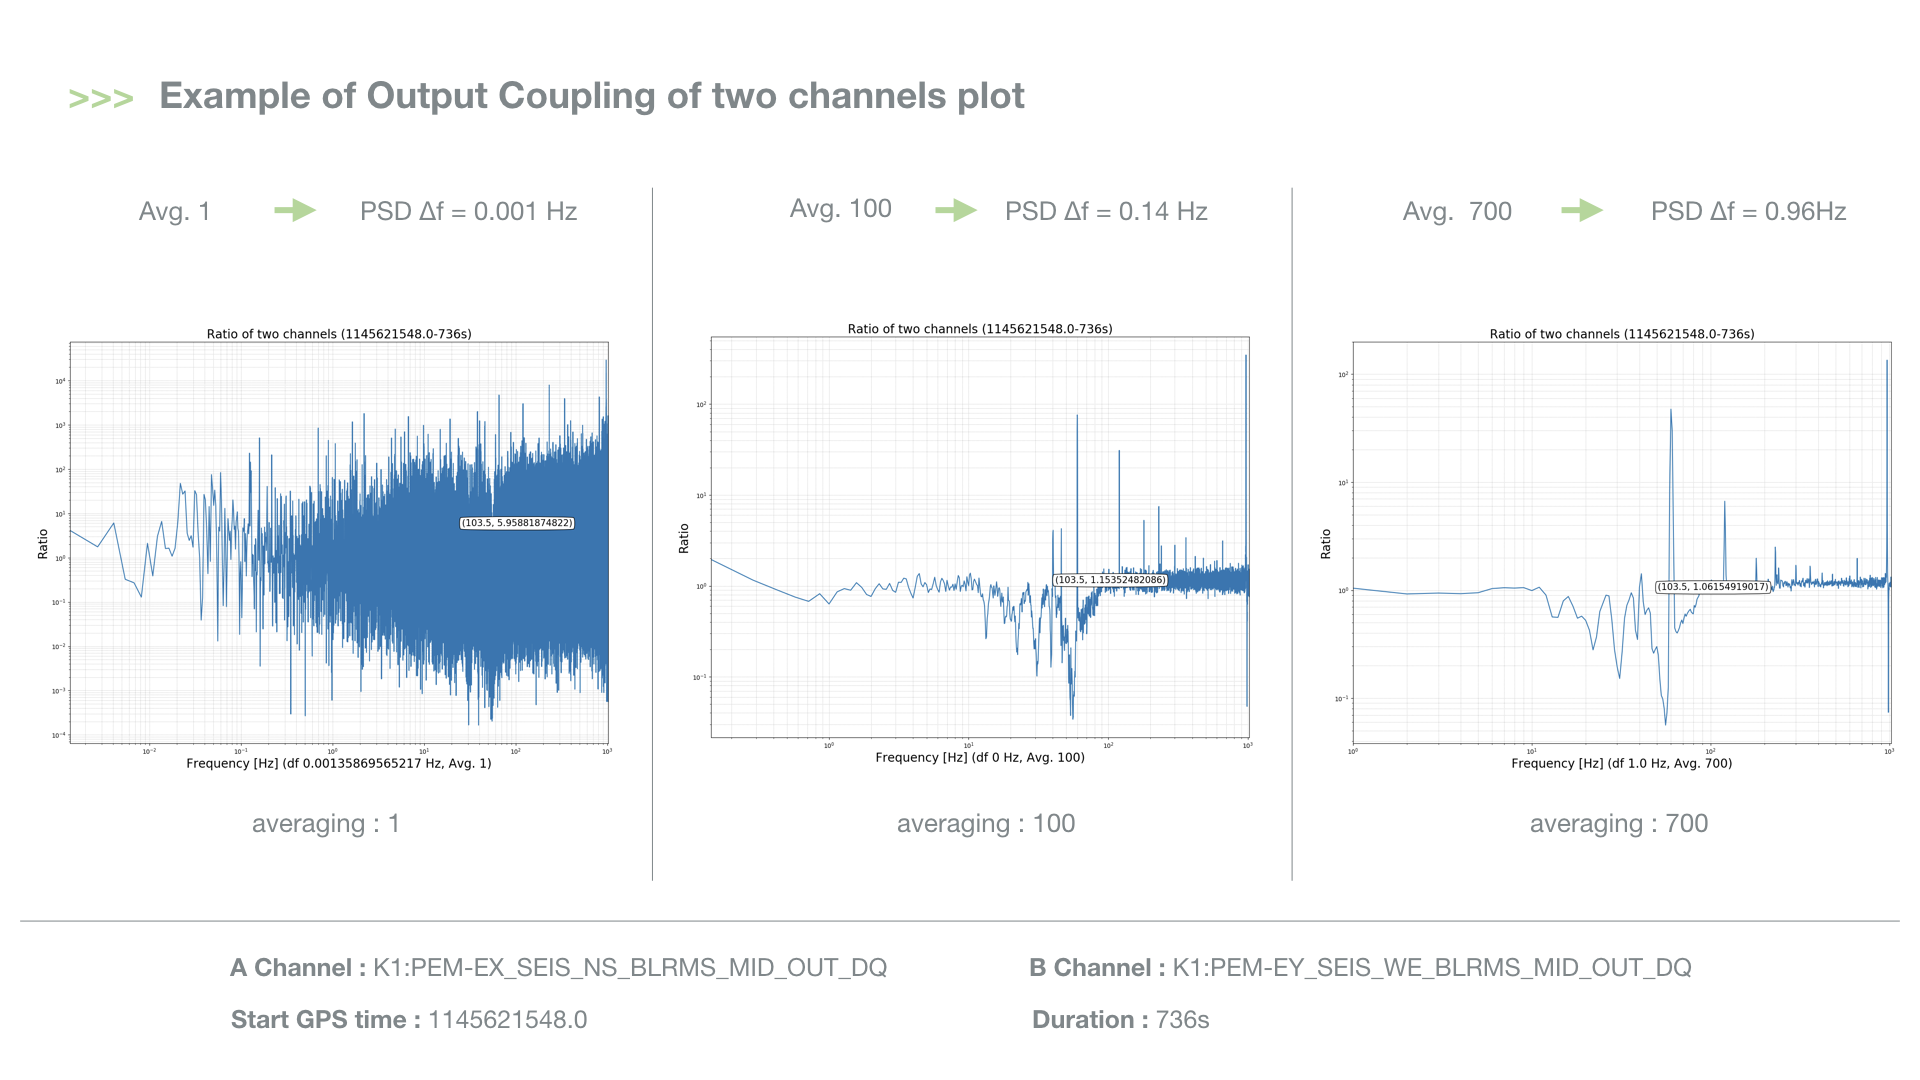
[detchar@k1det1 kagra_coupling_plot]$ python kagra_coupling_plot.py -ach K1:PEM-EX_SEIS_NS_BLRMS_MID_OUT_DQ -bch K1:PEM-EY_SEIS_WE_BLRMS_MID_OUT_DQ -s 1145621548.0 -d 736 -a 1 -f 103.5 -p 1

Loading Time series cache datas and time segment...

### Plotting PSD Ratio of K1:PEM-EX_SEIS_NS_BLRMS_MID_OUT_DQ to K1:PEM-EY_SEIS_WE_BLRMS_MID_OUT_DQ ###

 Saved Interploation Ratio plot in ./plot/1145621548.0-736/K1:PEM-EX_SEIS_NS_BLRMS_MID_OUT_DQ-to-K1:PEM-EY_SEIS_WE_BLRMS_MID_OUT_DQ direction

    Ratio for selected frequency 103.5 Hz : 5.95881874822

##### Completed #####
Slide
