|
Size: 3603
Comment:
|
Size: 4479
Comment:
|
| Deletions are marked like this. | Additions are marked like this. |
| Line 71: | Line 71: |
| {{attachment:LP-HP-BP.png}} == whitening == GWpy本家の[[https://gwpy.github.io/docs/stable/examples/timeseries/whiten.html|example]]を参照 {{{#!python from gwpy.timeseries import TimeSeries data = TimeSeries.get('H1:ASC-Y_TR_A_NSUM_OUT_DQ', 1123084671, 1123084703) white = data.whiten(4, 2) from gwpy.plot import Plot plot = Plot(data, white, separate=True, sharex=True) plot.axes[0].set_ylabel('Y-arm power [counts]', fontsize=16) plot.axes[1].set_ylabel('Whitened amplitude', fontsize=16) plot.show() }}} {{https://gwpy.github.io/docs/stable/examples/timeseries/whiten-3.png}} == ZPK(zeros, poles, gain) filter == GWpy本家の[[https://gwpy.github.io/docs/stable/examples/timeseries/filter.html|example]]および[[https://gwpy.github.io/docs/stable/api/gwpy.timeseries.TimeSeries.html#gwpy.timeseries.TimeSeries.zpk|TimeSeries.zpk()]]を参照 |
Contents
numpy, scipyなどのメモ
工事中
TimeSeriesの計算小技・注意事項
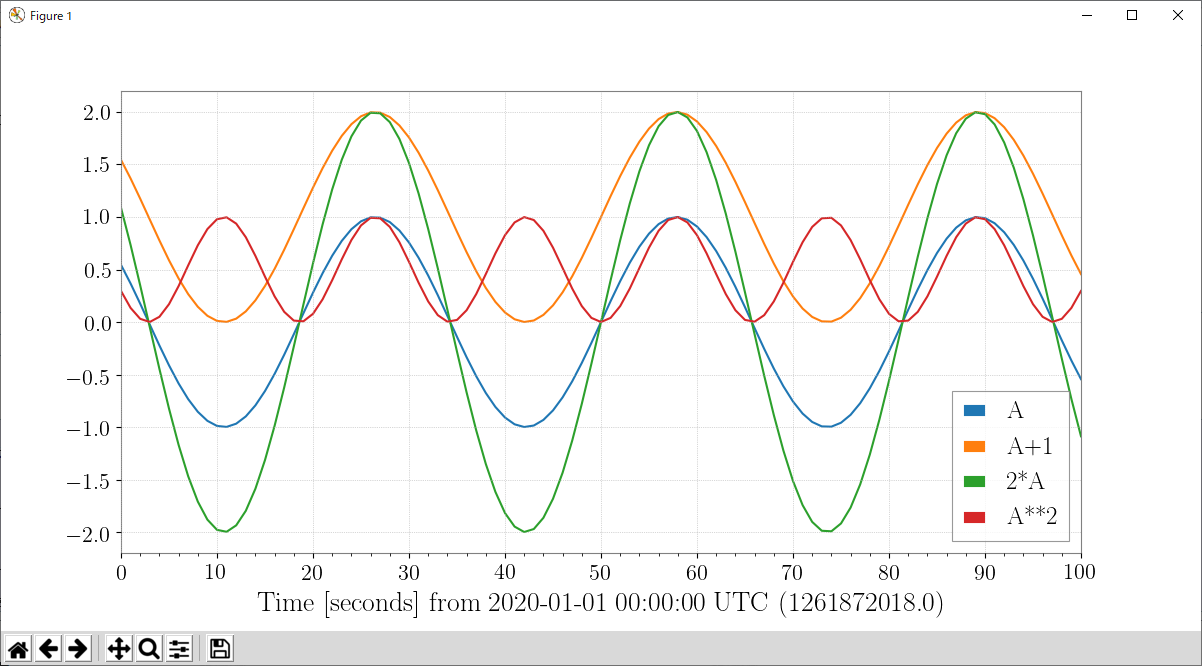
四則演算、指数
gwpyのTimeSeriesや FrequencySeriesは、 四則演算や指数の演算がそのまま使える。 横軸の配列(timesやfrequencies)が同一なら、TimeSeries同士の演算も可能。

FFT length の注意
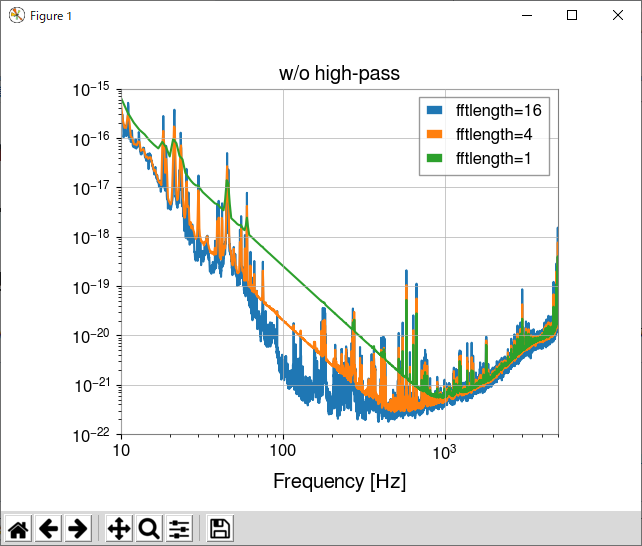
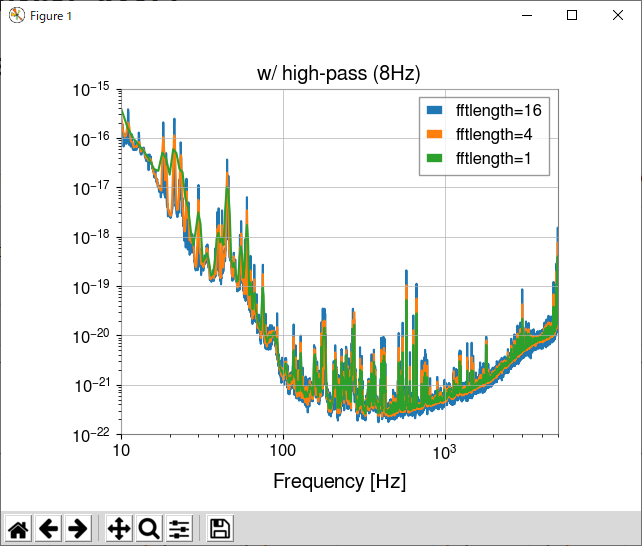
TimeSeriesからスペクトルを計算する際、fftlengthの値が小さいと下図左のように謎の冪スペクトルに埋もれてしまうことがある。(ドリフト+窓関数の影響?)
十分なfftlengthをとればいいのだが、平均回数を稼ぎたいときや短時間のみを見たい場合にはそうもいかない。
そんなときは先に適当なhighpassフィルターをかけることで、下図右のように回避できる。


FFT の窓関数について
窓関数について参考になるページ
Heinzel-Rudiger-Schilling
SciPy で使用可能な窓関数
小野精器 計測コラム
window |
周波数分解能 |
主な用途 |
推奨overlap |
hanning |
△ |
連続的な信号、一般的な信号 (とりあえずコレ) |
50% |
flattop |
× |
線スペクトルのピーク値に読み取り |
? |
boxcar |
〇 |
過渡信号、ハンマリング試験 |
0% |
gwpyのFFTでは、窓関数による減衰は補正されているっぽい。(Note参照)
試しに同じ時系列波形に対してhanningとflattopでASDを作ってband limited RMSを計算してみたら、同じ値になった。(補正なしだと2倍ほど変わるはず)
TimeSeriesにフィルターをかける
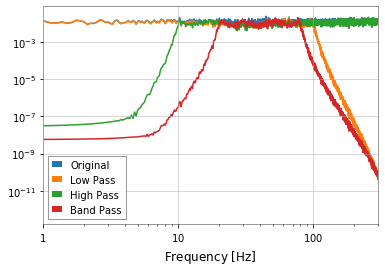
引数にカットオフ周波数を入れるだけで簡単にフィルターできる。
low pass, high pass, band pass
   1 from numpy import random
   2 data = TimeSeries(random.random(2**15), sample_rate=1024) # white noise を生成
   3 data_LP = data.lowpass(100)
   4 data_HP = data.highpass(10)
   5 data_BP = data.bandpass(20,80)
   6
   7 asd = data.asd(8,4)
   8 asd_LP = data_LP.asd(8,4)
   9 asd_HP = data_HP.asd(8,4)
  10 asd_BP = data_BP.asd(8,4)
  11
  12 plot = Plot(asd, asd_LP, asd_HP, asd_BP, xscale='log', yscale='log', xlim=(1,300))
  13 ax = plot.gca()
  14 ax.legend(['Original', 'Low Pass', 'High Pass', 'Band Pass'])
  15 plot.show()

whitening
GWpy本家のexampleを参照
   1 from gwpy.timeseries import TimeSeries
   2 data = TimeSeries.get('H1:ASC-Y_TR_A_NSUM_OUT_DQ', 1123084671, 1123084703)
   3 white = data.whiten(4, 2)
   4
   5 from gwpy.plot import Plot
   6 plot = Plot(data, white, separate=True, sharex=True)
   7 plot.axes[0].set_ylabel('Y-arm power [counts]', fontsize=16)
   8 plot.axes[1].set_ylabel('Whitened amplitude', fontsize=16)
   9 plot.show()

ZPK(zeros, poles, gain) filter
GWpy本家のexampleおよびTimeSeries.zpk()を参照
