|
Size: 746
Comment:
|
Size: 1026
Comment:
|
| Deletions are marked like this. | Additions are marked like this. |
| Line 15: | Line 15: |
== matplotlib色々 == [[https://qiita.com/simonritchie/items/da54ff0879ad8155f441|プロットの複雑なレイアウトはGridSpecが便利かも、という話]] [[https://bunseki-train.com/axvspan-and-axhspan/|matplotlibで一定区間に背景色をつける方法]] |
Plotの描画関連
時刻の基準を手で設定する
ここを参照
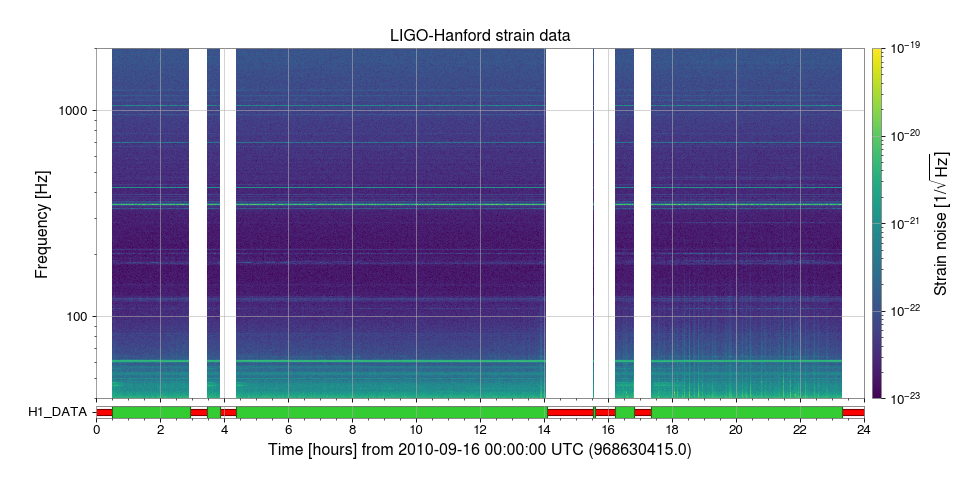
DQ Flagを添える
.add_segments_bar() を使う(ここを参照)。 他にも .add_state_segments() や .add_dataqualityflag() といった似たものがある。詳細はPlotting APIを参照。 
