|
Size: 1026
Comment:
|
Size: 2205
Comment:
|
| Deletions are marked like this. | Additions are marked like this. |
| Line 3: | Line 3: |
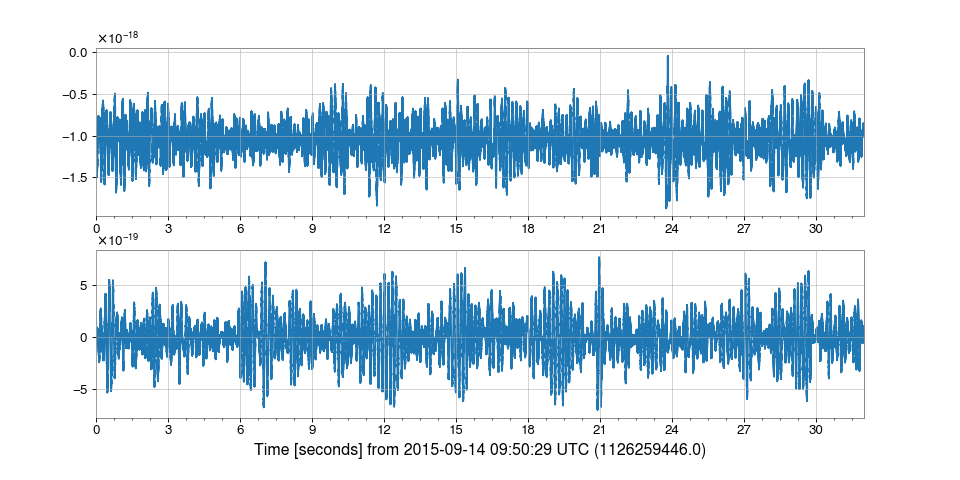
=== 複数の時系列を縦に並べてplotする === [[https://gwpy.github.io/docs/stable/timeseries/plot.html#plotting-multiple-timeseries-together|ここ]]に書いてある、gwpy.plotのPlot()がオススメ。<<BR>> 注意点は、TimeSeriesのlistやTimeSeriesDictを引数にしてまとめて渡した場合は ''separate=True'' をしても分割されないという謎仕様。面倒だが1つ1つ手で並べる必要がある。 {{{#!python from gwpy.plot import Plot plot = Plot(l1hoft, h1hoft) plot = Plot(l1hoft, h1hoft, separate=True, sharex=True) plot.show() }}} {{https://gwpy.github.io/docs/stable/_images/plot-7.png}} 戻り値 (ここでは ''plot'')は、[[https://matplotlib.org/3.2.1/api/_as_gen/matplotlib.pyplot.figure.html|matplotlibのfigure]]だと思ってしまってよい。<<BR>> なので、それぞれのy軸ラベルや全体のタイトルを付けるには以下のようにする。 {{{#!python import matplotlib.pyplot as plt axes = plot.get_axes() ylabel = ['y1','y2'] for i, ax in enumerate(axes): ax.set_ylabel(ylabel[i]) plt.tight_layout() plt.subplots_adjust(top=0.95) plot.suptitle('title') }}} |
|
| Line 12: | Line 36: |
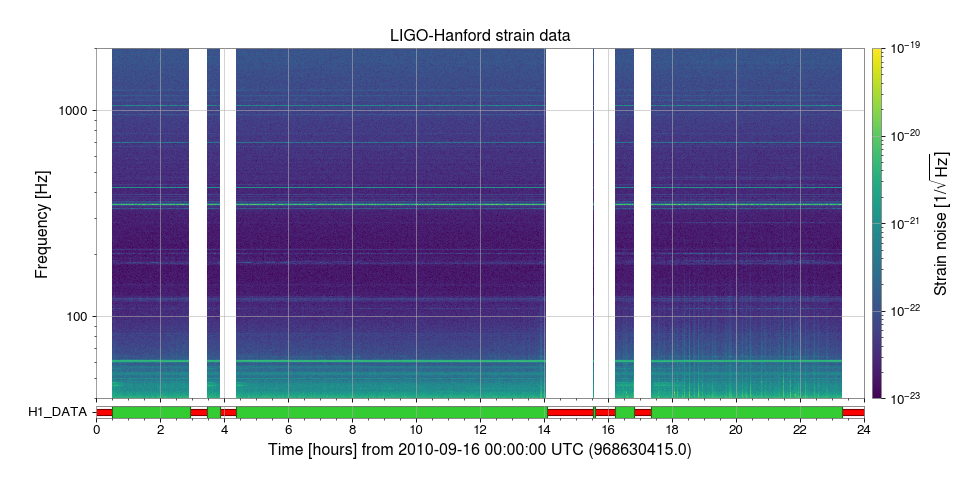
| ''.add_segments_bar()'' を使う([[https://gwpy.github.io/docs/latest/examples/miscellaneous/open-data-spectrogram.html|ここ]]を参照)。 | ''.add_segments_bar()'' を使う([[https://gwpy.github.io/docs/latest/examples/miscellaneous/open-data-spectrogram.html|ここ]]を参照)。<<BR>> |
Plotの描画関連
複数の時系列を縦に並べてplotする
ここに書いてある、gwpy.plotのPlot()がオススメ。
注意点は、TimeSeriesのlistやTimeSeriesDictを引数にしてまとめて渡した場合は separate=True をしても分割されないという謎仕様。面倒だが1つ1つ手で並べる必要がある。

戻り値 (ここでは plot)は、matplotlibのfigureだと思ってしまってよい。
なので、それぞれのy軸ラベルや全体のタイトルを付けるには以下のようにする。
時刻の基準を手で設定する
ここを参照
DQ Flagを添える
.add_segments_bar() を使う(ここを参照)。
他にも .add_state_segments() や .add_dataqualityflag() といった似たものがある。詳細はPlotting APIを参照。 
