|
Size: 3891
Comment:
|
Size: 5490
Comment:
|
| Deletions are marked like this. | Additions are marked like this. |
| Line 76: | Line 76: |
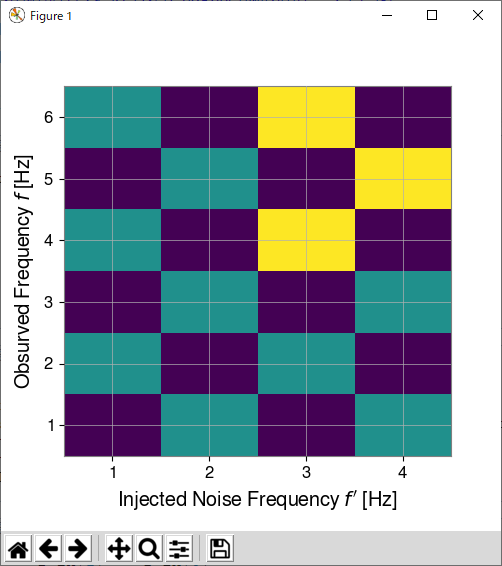
=== imshow を使って2Dヒストグラムを書く時の軸の取り方 === 以下のような2変数f_in, f_outの間の相関データを、imshowを使って2Dヒストグラムとして描画したいとしよう。 {{{#!python matrix = [[0, 1, 0, 1], [1, 0, 1, 0], [0, 1, 0, 1], [1, 0, 2, 0], [0, 1, 0, 2], [1, 0, 2, 0]] f_in = [1,2,3,4] f_out = [1,2,3,4,5,6] }}} 素直に以下のように書くと、縦軸が反転して(上から下になる)しまい、bin幅もごみになる。 {{{#!python fig = Plot(figsize=(5, 5)) ax = fig.gca() ax.imshow(matrix, extent=[f_in[0], f_in[-1], f_out[0], f_out[-1]], aspect='auto', interpolation='nearest') ax.set_xlabel("Injected Noise Frequency $f'$ [Hz]") ax.set_ylabel('Obsurved Frequency $f$ [Hz]') fig.show() }}} {{attachment:imshow_bad.png}} 縦軸の向きは origin='lower' を入れると下から上になる。<<BR>> bin幅については、上下左右に半分ずつ追加することで変数の値(今の場合はf_in, f_out)がbin中心になるようにできる。 {{{#!python df_in = f_in[1] - f_in[0] df_out = f_out[1] - f_out[0] f_L = f_in[0] - df_in*0.5 f_R = f_in[-1]+ df_in*0.5 f_B = f_out[0] - df_out*0.5 f_T = f_out[-1]+ df_out*0.5 fig = Plot(figsize=(5, 5)) ax = fig.gca() ax.imshow(matrix, extent=[f_L, f_R, f_B, f_T], aspect='auto', origin='lower', interpolation='nearest') ax.set_xlabel("Injected Noise Frequency $f'$ [Hz]") ax.set_ylabel('Obsurved Frequency $f$ [Hz]') fig.show() }}} {{attachment:imshow_good.png}} |
Plotの描画関連
複数の時系列を縦に並べてplotする
ここに書いてある、gwpy.plotのPlot()がオススメ。
GUIで拡大等をしたとき、他のaxesも一緒に動く。
注意点は、TimeSeriesのlistやTimeSeriesDictを引数にしてまとめて渡した場合は separate=True をしても分割されないという謎仕様。面倒だが1つ1つ手で並べる必要がある。
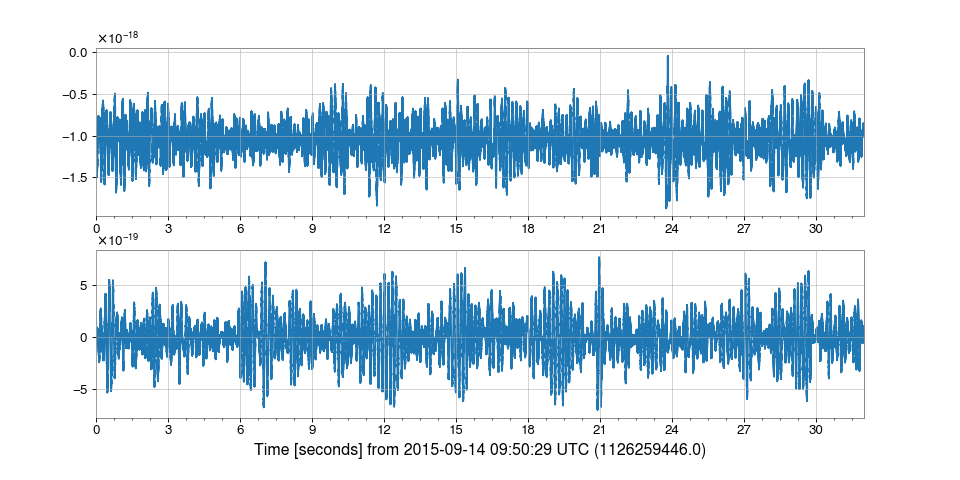
戻り値 (ここでは plot)は、matplotlibのfigureだと思ってしまってよい。
なので、それぞれのy軸ラベルや全体のタイトルを付けるには以下のようにする。
時刻の基準を手で設定する
ここを参照
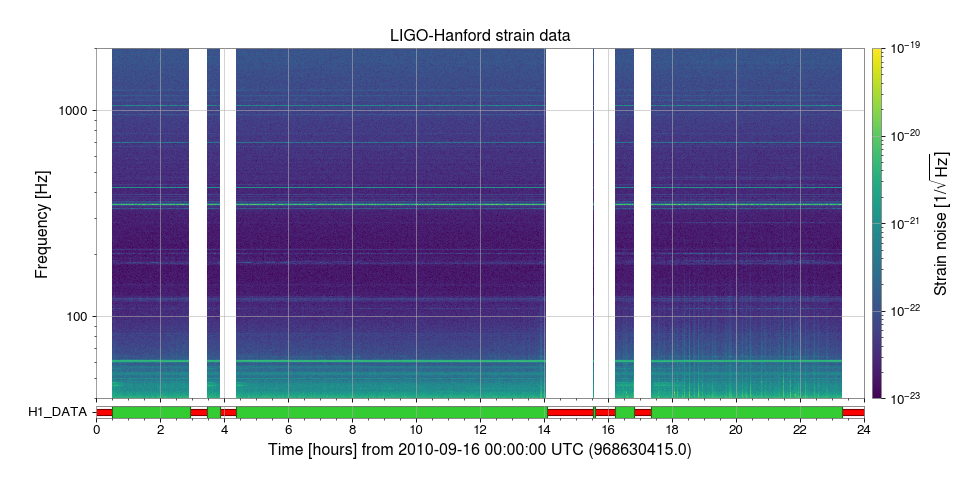
DQ Flagを添える
.add_segments_bar() を使う(ここを参照)。
他にも .add_state_segments() や .add_dataqualityflag() といった似たものがある。詳細はPlotting APIを参照。
スペクトルのパーセンタイル/σバンドを付ける
ここを参照。手順としては、
まずTimeSeriesからspectrogram2()を使ってnon-averaged power Spectrogramを作る。
- .percentile() でパーセンタイルのスペクトルを3つ作る。
- plot_mmm() で描画するとバンド付きでplotされる。
   1 from gwpy.timeseries import TimeSeries
   2 from gwpy.plot import Plot
   3
   4 hoft = TimeSeries. ...
   5 sg = hoft.spectrogram2(fftlength=4, overlap=2, window='hanning') ** (1/2.)
   6 median = sg.percentile(50)
   7 low = sg.percentile(5)
   8 high = sg.percentile(95)
   9
  10 plot = Plot()
  11 ax = plot.gca(xscale='log', xlim=(10, 1500), xlabel='Frequency [Hz]',  yscale='log', ylim=(3e-24, 2e-20),  ylabel=r'Strain noise [1/$\sqrt{\mathrm{Hz}}$]')
  12 ax.plot_mmm(median, low, high, color='gwpy:ligo-hanford')
  13 ax.set_title('LIGO-Hanford strain noise variation around GW170817', fontsize=16)
  14 plot.show()
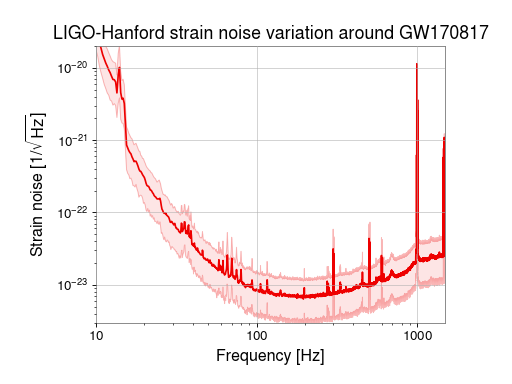
パーセンタイルではなくmeanとσで表したい場合は、Spectrogramの2次元配列に対して時間軸(0軸)方向にmean, stdを取ればよい。
matplotlib色々
imshow を使って2Dヒストグラムを書く時の軸の取り方
以下のような2変数f_in, f_outの間の相関データを、imshowを使って2Dヒストグラムとして描画したいとしよう。
素直に以下のように書くと、縦軸が反転して(上から下になる)しまい、bin幅もごみになる。
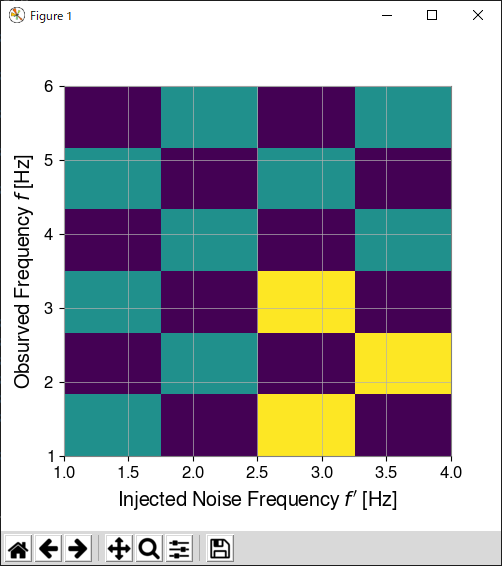
縦軸の向きは origin='lower' を入れると下から上になる。
bin幅については、上下左右に半分ずつ追加することで変数の値(今の場合はf_in, f_out)がbin中心になるようにできる。
   1 df_in  = f_in[1]  - f_in[0]
   2 df_out = f_out[1] - f_out[0]
   3
   4 f_L = f_in[0] - df_in*0.5
   5 f_R = f_in[-1]+ df_in*0.5
   6 f_B = f_out[0] - df_out*0.5
   7 f_T = f_out[-1]+ df_out*0.5
   8
   9 fig = Plot(figsize=(5, 5))
  10 ax = fig.gca()
  11 ax.imshow(matrix, extent=[f_L, f_R, f_B, f_T], aspect='auto', origin='lower', interpolation='nearest')
  12 ax.set_xlabel("Injected Noise Frequency $f'$ [Hz]")
  13 ax.set_ylabel('Obsurved Frequency $f$ [Hz]')
  14 fig.show()
