|
Size: 824
Comment:
|
Size: 669
Comment:
|
| Deletions are marked like this. | Additions are marked like this. |
| Line 1: | Line 1: |
| = 2018/04/18のデータ = | = Oplev Summary Page = |
| Line 3: | Line 3: |
| == MC == {{attachment:MCO.png| Diagram|width="500"|hight="200"}} == IMMT == {{attachment:IMMT1.png| Diagram|width="500"}} {{attachment:IMMT2.png| Diagram|width="500"}} |
== MC & IMMT == {{attachment:MC.png| Diagram|width=500",height="300"}} {{attachment:IMMT.png| Diagram|width="500",height="300"}} |
| Line 9: | Line 7: |
| === PRM === {{attachment:PRM_LEN.png| Diagram|width="500"}} {{attachment:PRM_TILT.png| Diagram|width="500"}} === PR2 === {{attachment:PR2_LEN.png| Diagram|width="500"}} {{attachment:PR2_TILT.png| Diagram|width="500"}} === PR3 === {{attachment:PR3_LEN.png| Diagram|width="500"}} {{attachment:PR3_TILT.png| Diagram|width="500"}} == BS == {{attachment:BS_LEN.png| Diagram|width="500"}} {{attachment:BS_TILT.png| Diagram|width="500"}} |
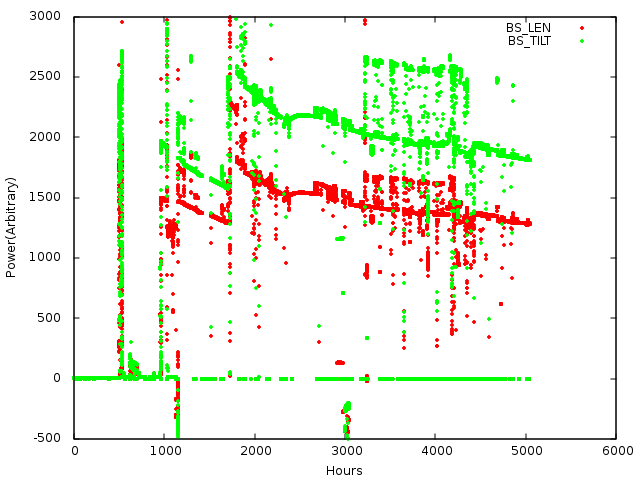
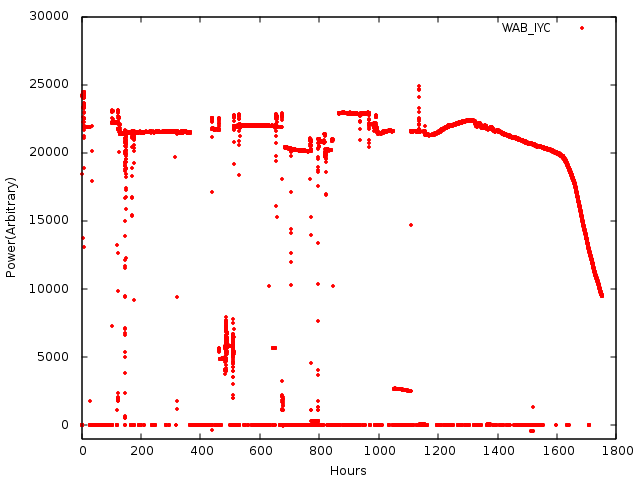
{{attachment: PRM.png| Diagram|width="500",height="300"}} {{attachment:PR2_PR3.png| Diagram|width="500",height="300"}} == BS & WAB == {{attachment:BS.png| Diagram|width="500",height="300"}} {{attachment:WAB_IYC_new.png| Diagram|width="500",height="300"}} |
| Line 22: | Line 13: |
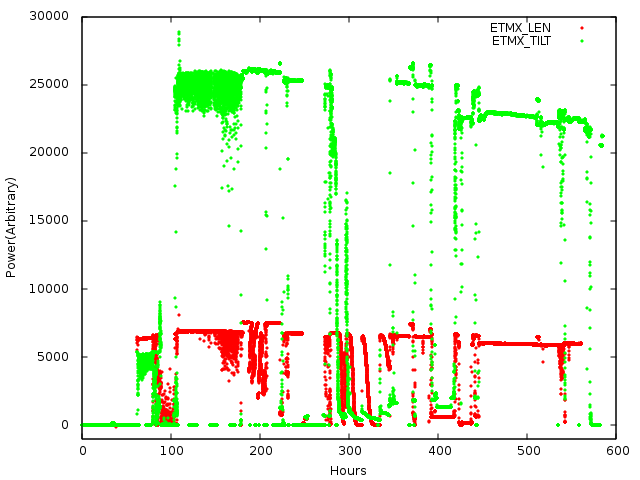
| {{attachment:ETMX_LEN.png| Diagram|width="500"}} | {{attachment:ETMX.png| Diagram|width="500",height="300"}} {{attachment:ETMY.png| Diagram|width="500",height="300"}} |
| Line 24: | Line 16: |
| {{attachment:ETMY_LEN_new.png| Diagram|width="500"}} {{attachment:ETMY_TILT.png| Diagram|width="500"}} |
== Rough estimation of reducing slope == ||<#FFFF00>Oplev type||<#FFFF00>Slope[count/hour]|| ||MCI||5.0|| |
Oplev Summary Page
MC & IMMT
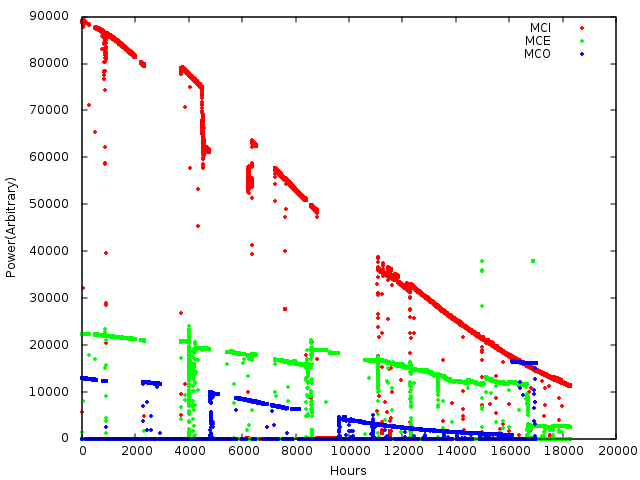
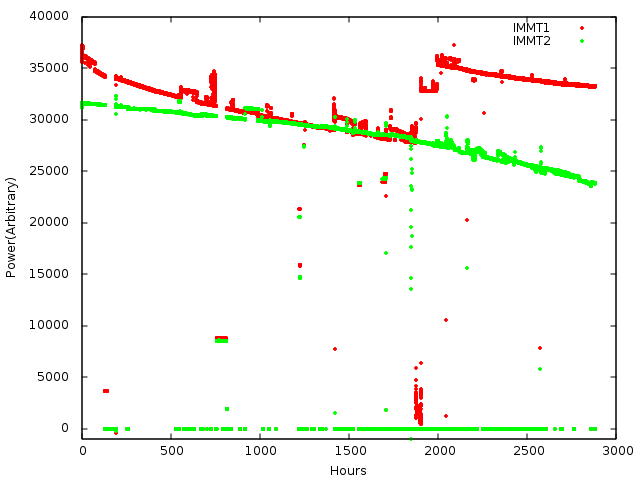
PR
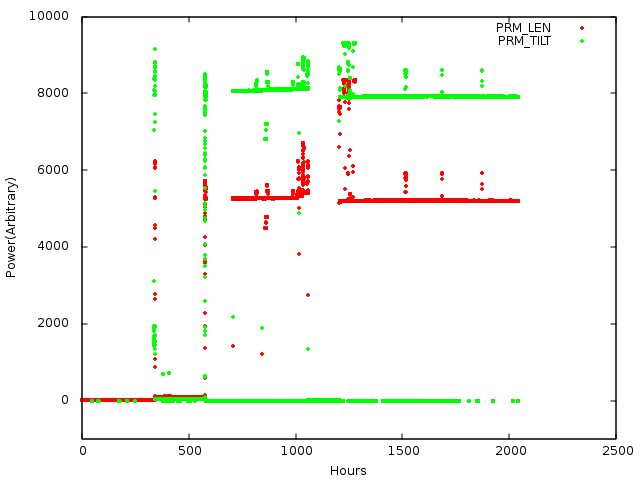
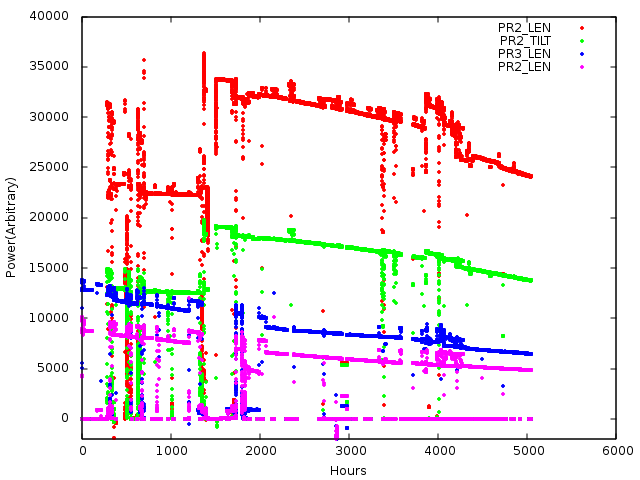
BS & WAB
ETM
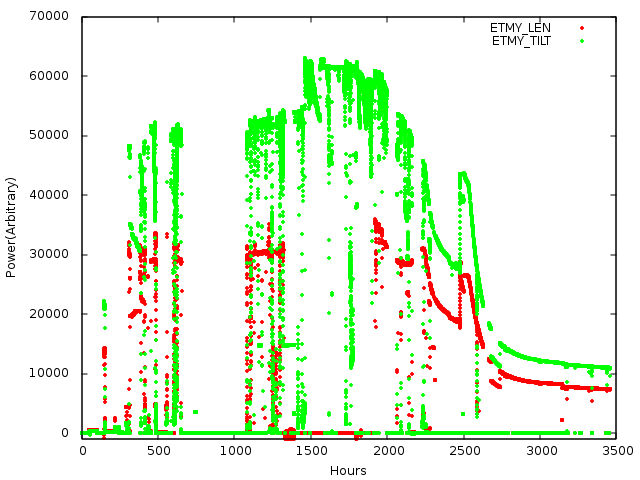
Rough estimation of reducing slope
Oplev type |
Slope[count/hour] |
MCI |
5.0 |
