|
Size: 1264
Comment:
|
Size: 781
Comment:
|
| Deletions are marked like this. | Additions are marked like this. |
| Line 2: | Line 2: |
| Horizontal size is roughly adjusted to the range of x axis. | |
| Line 5: | Line 4: |
| {{attachment:MCE.png| Diagram|width="1000",height="400"}} {{attachment:MCI.png| Diagram|width="1000",height="400"}} {{attachment:MCO.png| Diagram|width="1000",height="400"}} |
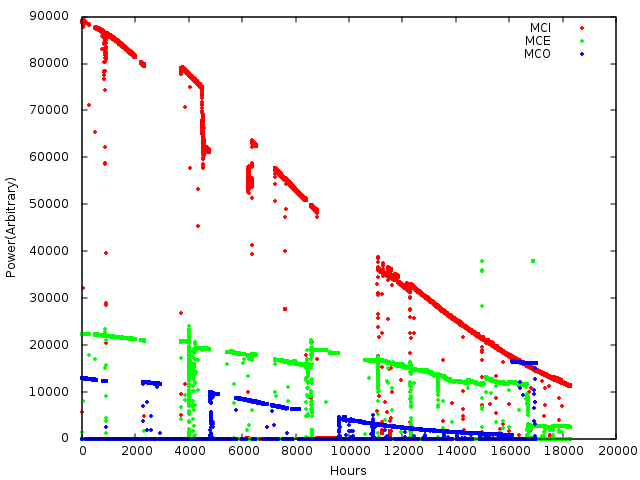
{{attachment:MC.png| Diagram|width="500",height="300"}} |
| Line 11: | Line 6: |
| {{attachment:IMMT1.png| Diagram|width="400",height="300"}} {{attachment:IMMT2.png| Diagram|width="400",height="300"}} |
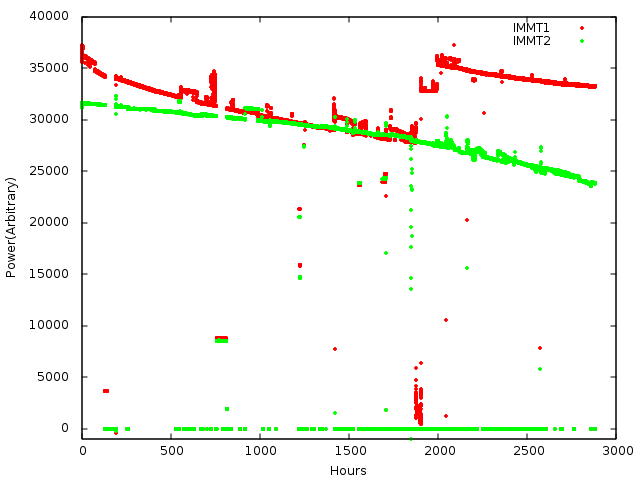
{{attachment:IMMT.png| Diagram|width="500",height="300"}} |
| Line 14: | Line 8: |
| === PRM === {{attachment:PRM_LEN_new.png| Diagram|width="350",height="300"}} {{attachment:PRM_TILT_new.png| Diagram|width="350",height="300"}} === PR2 === {{attachment:PR2_LEN.png| Diagram|width="600",height="300"}} {{attachment:PR2_TILT.png| Diagram|width="600",height="300"}} === PR3 === {{attachment:PR3_LEN.png| Diagram|width="600",height="300"}} {{attachment:PR3_TILT.png| Diagram|width="600",height="300"}} |
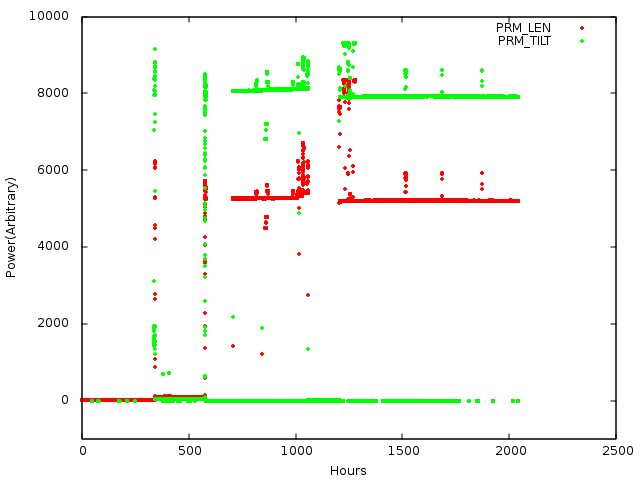
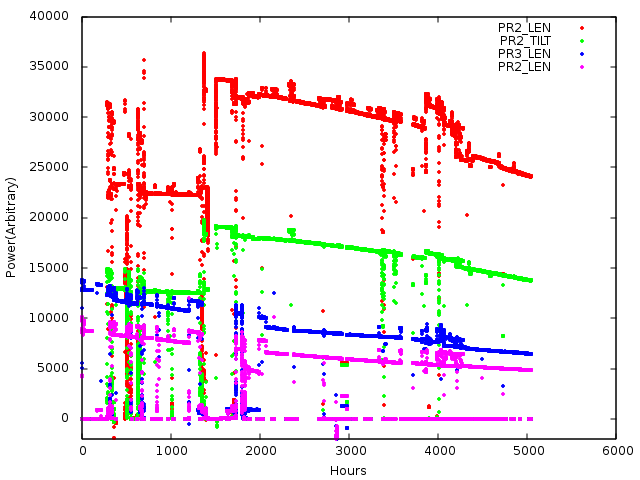
{{attachment: PRM.png| Diagram|width="500",height="300"}} {{attachment:PR2_PR3.png| Diagram|width="500",height="300"}} |
| Line 30: | Line 17: |
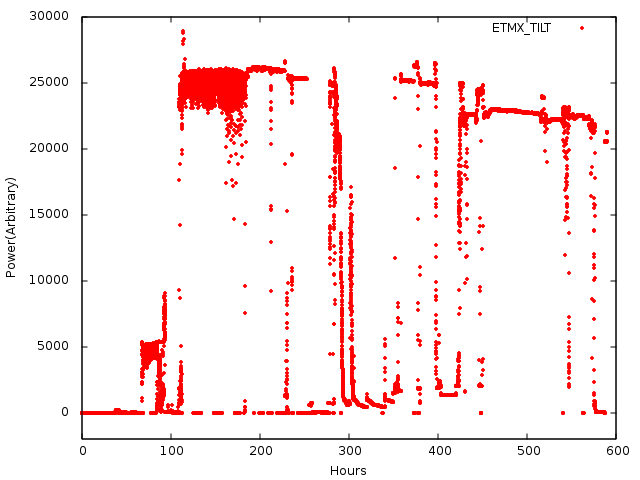
| {{attachment:ETMX_TILT.png| Diagram|width="300",height="300"}} |
Oplev Summary Page
MC
IMMT
PR
BS
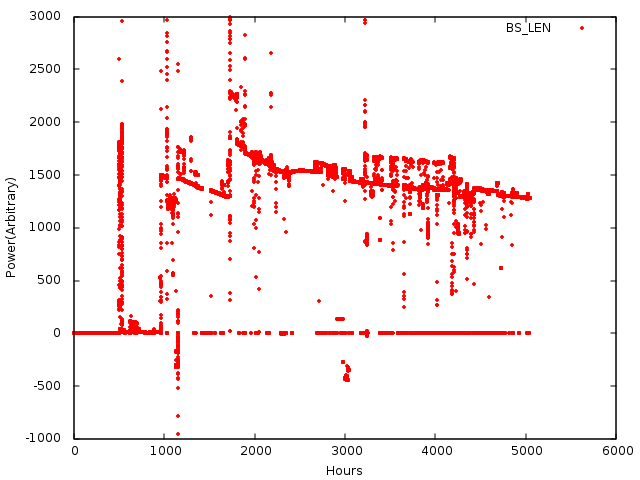
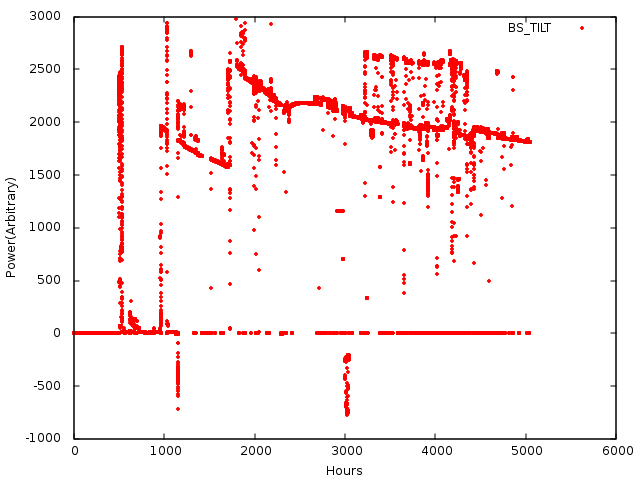
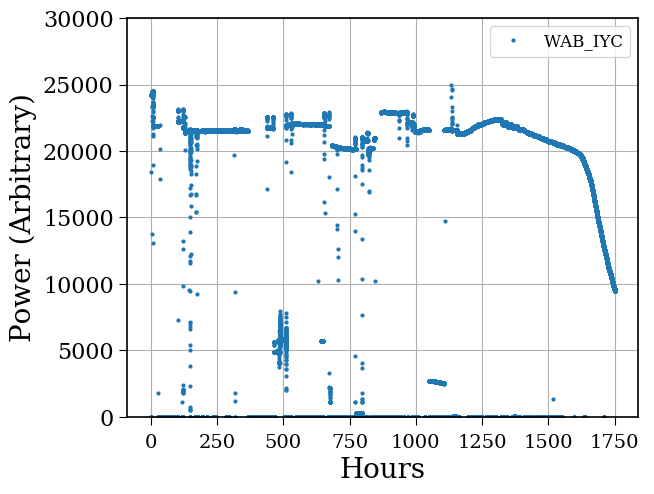
WAB
ETM
