
CAGMon - A Detchar Tool for Noise Propagation using Correlation Analysis
Contents
Project Goal
The goal of this project is to find a systematic way of identifying the abnormal glitches in the gravitational-wave data using various methods of correlation analysis. Usually the community such as LIGO and Virgo uses a conventional way of finding glitches in auxiliary channels of the detector - Klein-Welle, Omicron, Ordered Veto Lists, etc. However, some different ways can be possible to find and monitor them in a (quasi-) realtime. Also the method can point out which channel is responsible for the found glitch. In this project, we study its possibility to apply three different correlation methods - maximal information coefficient, Pearson's correlation coefficient, and Kendall's tau coefficient - in the gravitational wave data from LIGO detector.
Participants
- John J. Oh (lead, NIMS)
- Young-Min Kim (UNIST)
- More....
Preliminaries
Old Link of CAGMon Project@KGWG Wiki
Methods
Pearson's Correlation Coefficient
- PCC is a measure of a linear correlation between two random variables.
- Pearson's r is defined as:
- \[ r=\frac{\sum_{i=1}^{n} (x_i - \bar{x})(y_i-\bar{y})}{\sqrt{\sum_{i=1}^{n} (x_i-\bar{x})^2} \sqrt{\sum_{i=1}^{n} (y_i -\bar{y})^2}} \]
Kendall's tau Coefficient
- \[ \tau = \frac{2(C-D)}{n(n-1)} \]
where C and D are number of concordant and disconcordant pairs, respectively.
Maximal Information Coefficient
Basically, maximal information coefficient is defined using the mutual information score following the Ref. [1]. Formally, the mutual information of two discrete random variables X and Y can be defined as: \begin{align} I(X;Y) = \sum_{y\in Y} \sum_{x\in X} p(x, y) \log \left(\frac{p(x, y)}{p(x)p(y)}\right) \end{align}
where p(x,y) is the joint probability distribution function of X and Y, and p(x) and p(y) are the marginal probability distribution functions of X and Y respectively. Intuitively, mutual information measures the information that X and Y share: it measures how much knowing one of these variables reduces uncertainty about the other. For example, if X and Y are independent, then knowing X does not give any information about Y and vice versa, so their mutual information is zero [Wikipedia].
It measures non-linear correlation between two data samples while the PCC (Pearson correlation coefficient) and the Spearman coefficient are only for the linear relationship.
With this definition of mutual information, MIC is defined by [2] \[ MIC(D) = \max_{xy
Preliminary Knowledges
Previous Study Results
References
CAGMonLKR3 Guide : to be updated
GitLab: to be pushed
D. N. Reshef, Y. A. Reshef, H. K. Finucane, S. R. Grossman, G. McVean, P. J. Turnbaugh, E. S. Lander, M. Mitzenmacher, P. C. Sabeti, Science, 334, 1518 (2011).
System Requirements for KAGMon
- python 3
- numpy
- scipy
- matplotlib
- minepy
- gwpy
Data & Code Preparation
KAGRA ER2 Data (2020.2-2020.5)
- location: ldg-ui @ sdfarm -- /data/kagra/archive/data/full/
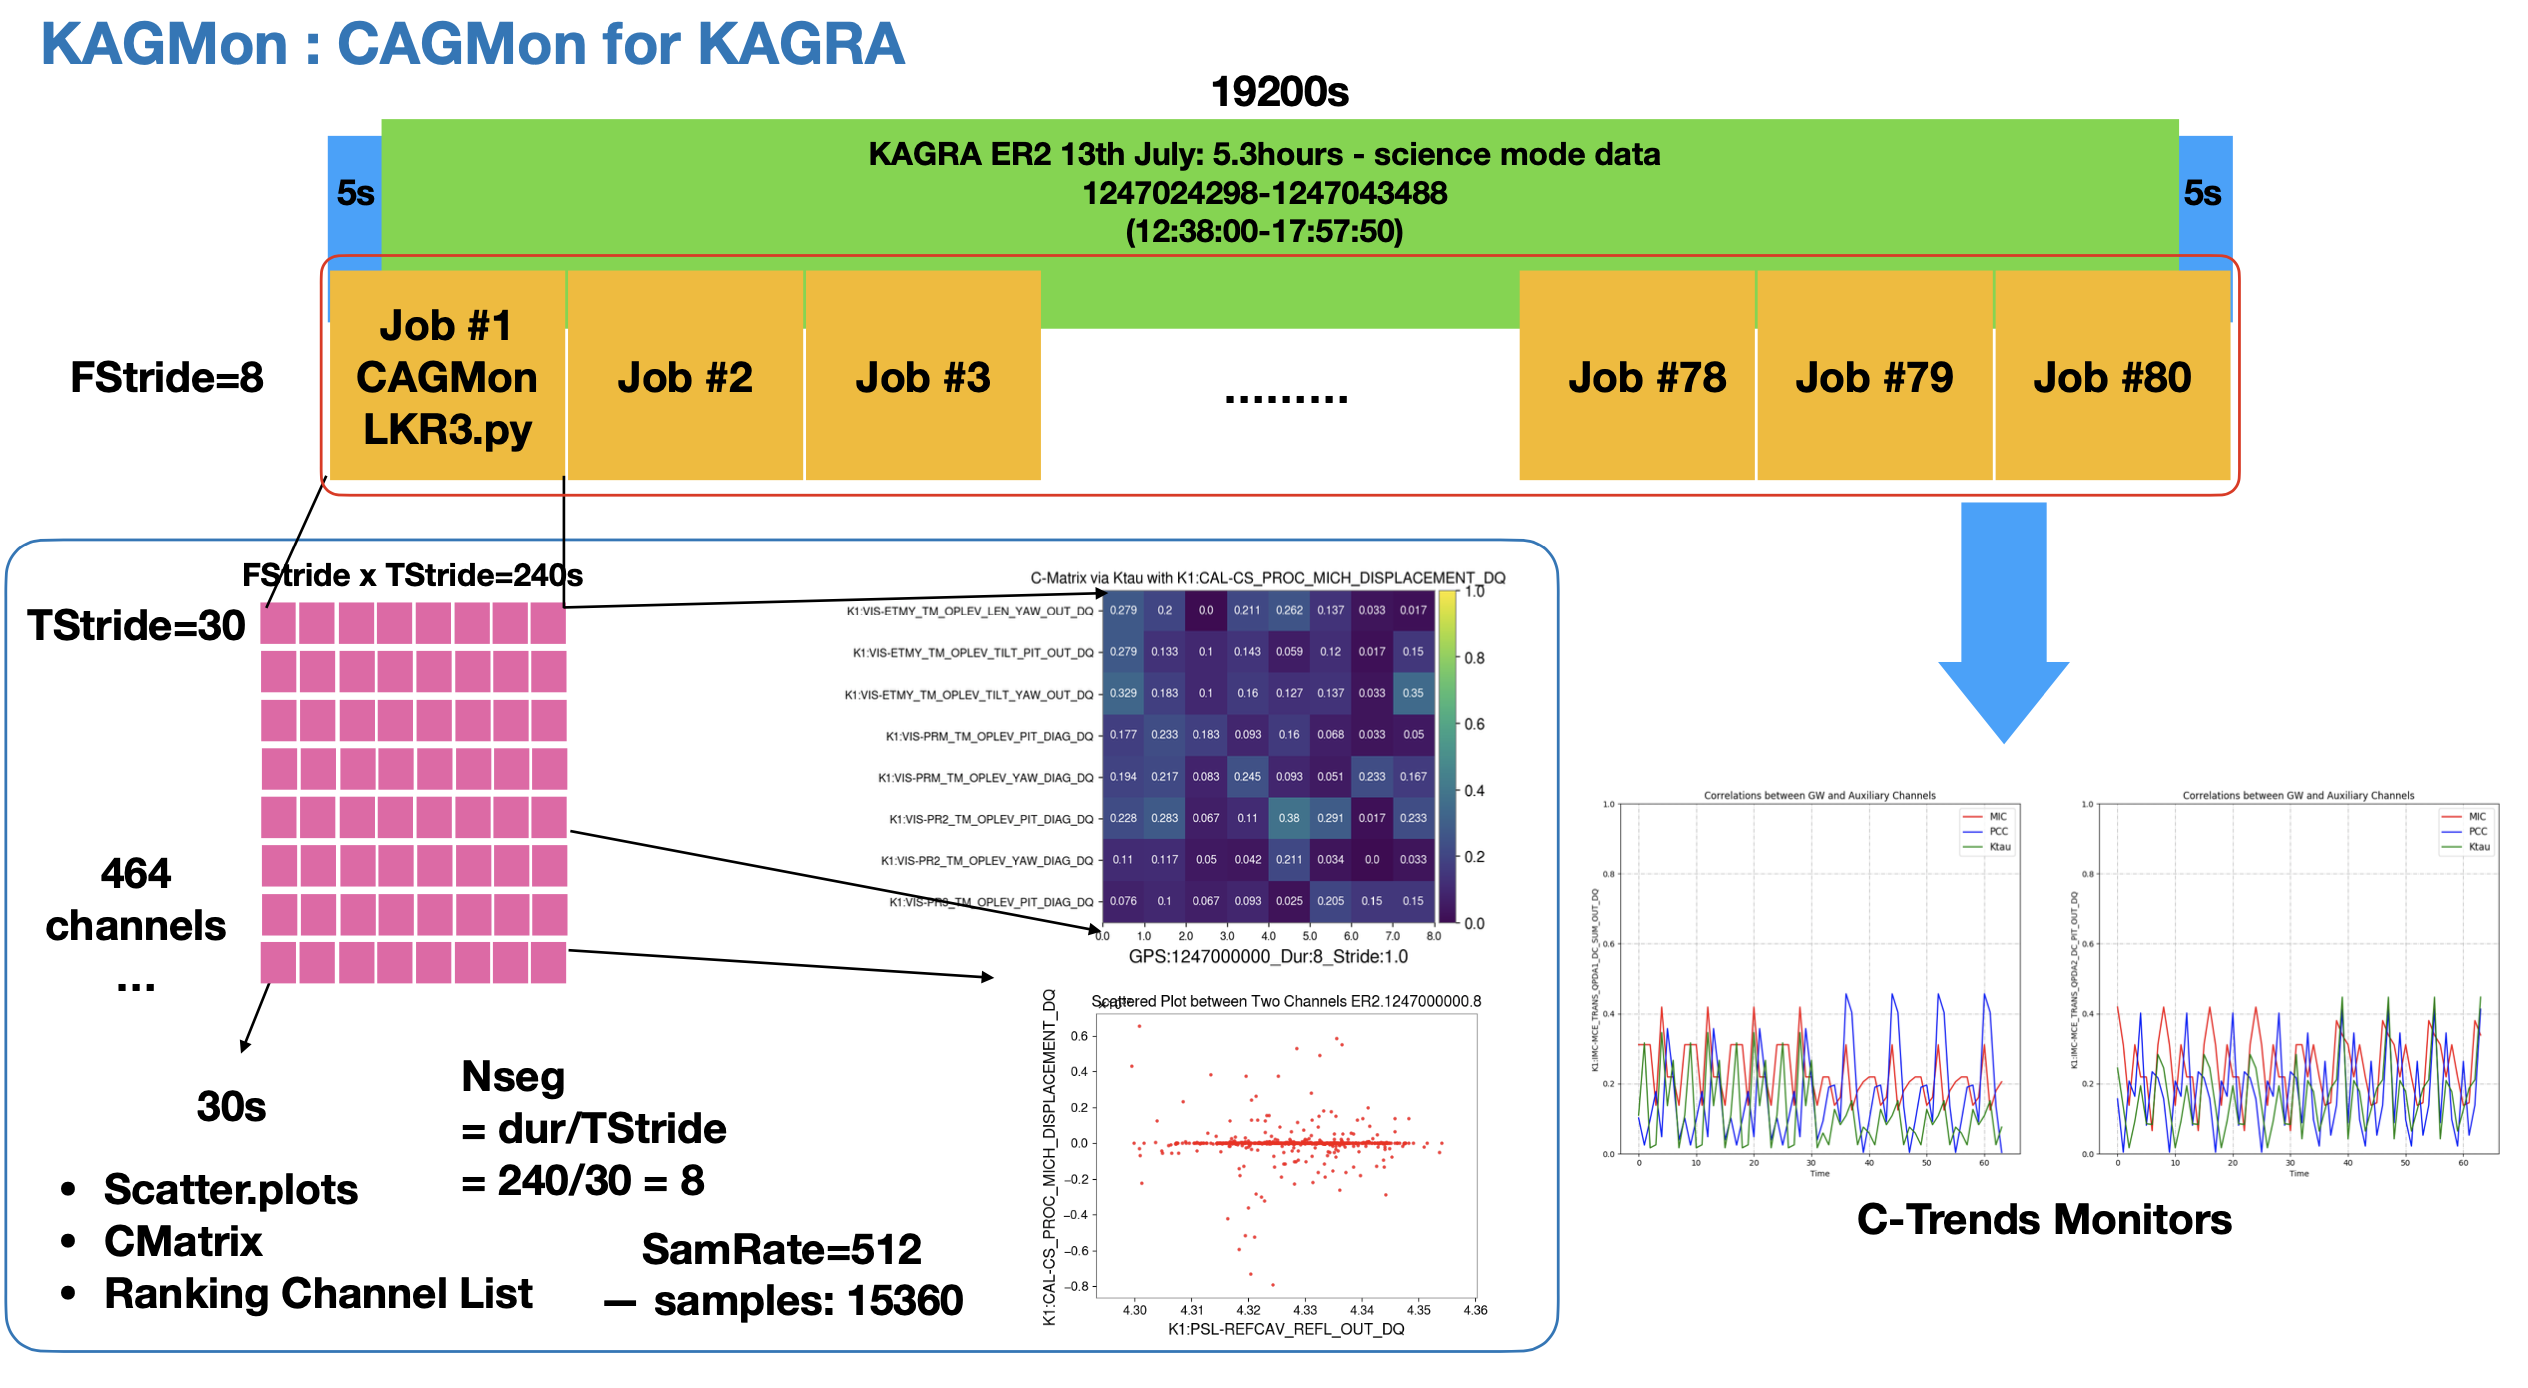
1247024298 / 5 hours (2019. Jul. 13 12:38:00- 17:57:50) http://gwwiki.icrr.u-tokyo.ac.jp/JGWwiki/KAGRA/Subgroups/DET/RUN/ER190713
Summary page: Run Status -- https://www.icrr.u-tokyo.ac.jp/~yuzu/bKAGRA_summary/html/20190713_GlitchPlot.html
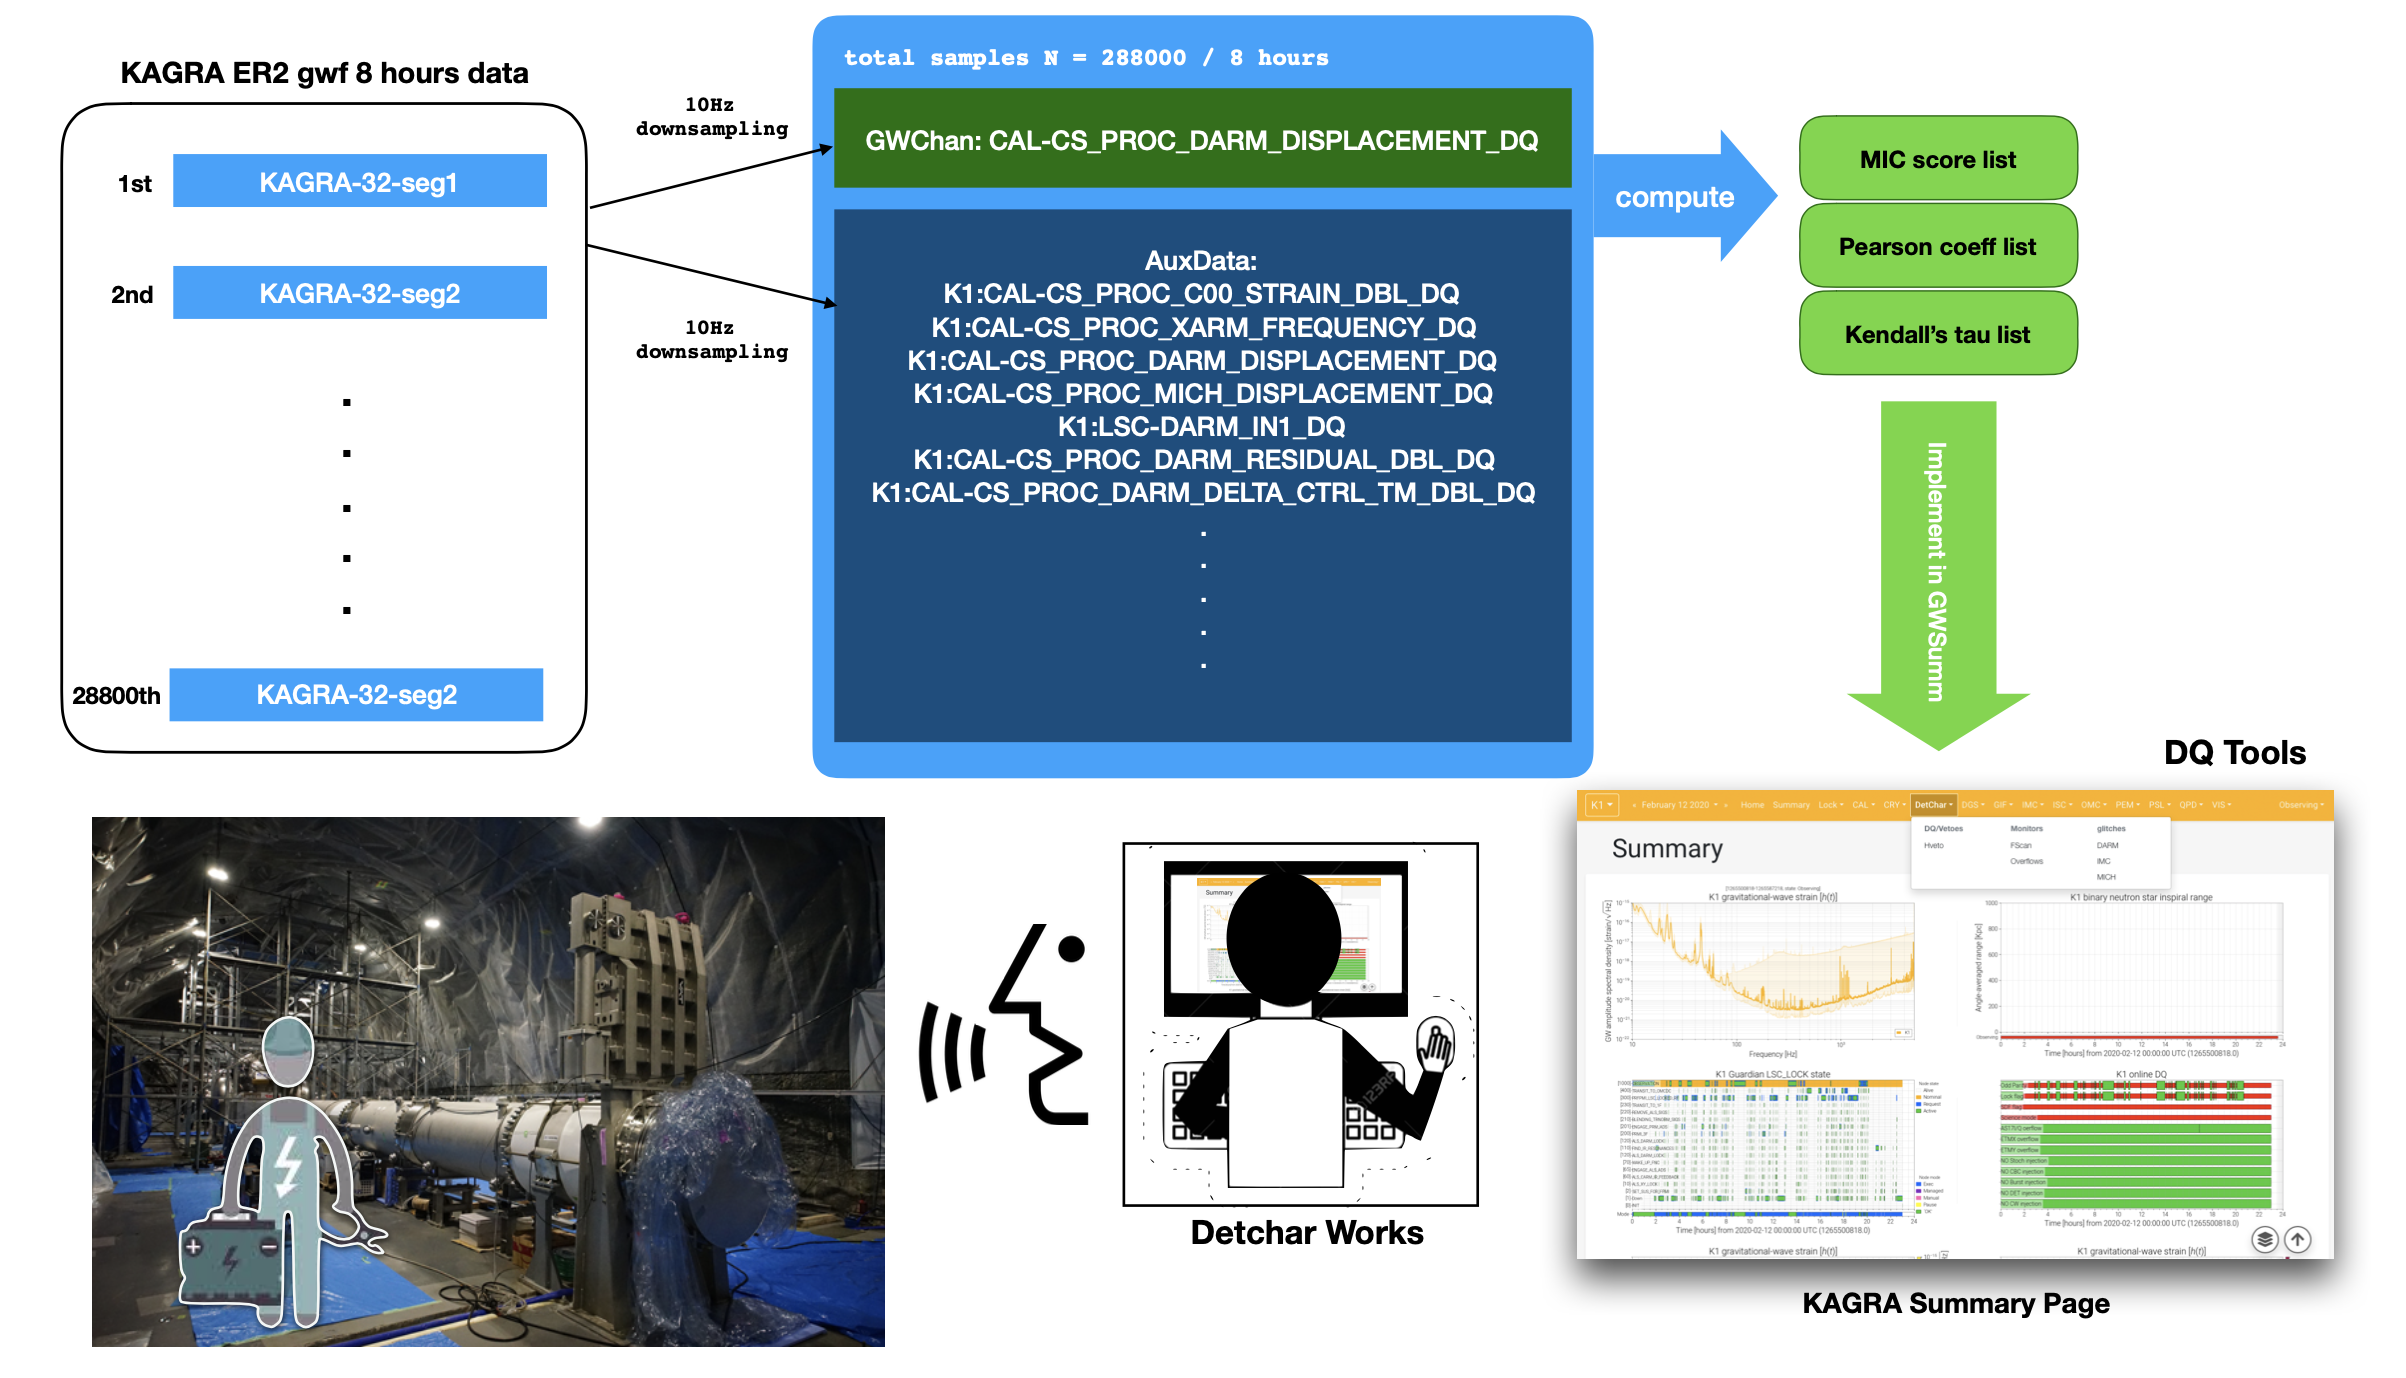
- TStride = 30, FStride = 8 / dur = 240 / 80 Jobs
- Main Channel: K1:CAL-CS_PROC_MICH_DISPLACEMENT_DQ
- Aux Channels: 464 DQ Channels (+ unsafe)
LIGO Data (2020.6~ )
O3 glitches and their witness channels : https://wiki.ligo.org/DetChar/GlitchesandWitnesses
- list of glitches
- Magnetometer set
- gpstimes: /home/cavaglia/karoo_omicron_O2endxmag/data/gpstimes_endxmag_triggers_sorted_analyzed_ready_1-2049.txt @LLO (ldas-pcdev1.ligo-la.caltech.edu)
- Air Compressor set
- gpstimes: /home/cavaglia/karoo_omicron_O1aircompressor/data/gpstimes_O1aircompressor_sorted.txt @ LHO(ldas-pcdev1.ligo-wa.caltech.edu)
- Magnetometer set
Scheme & Goal


Preliminary Run Tests:
Summary of 19200s Run: KAGRA-CAGMonTest.pdf
Observing Run Test of KAGRA O1
Trigger-based Analysis (2020.6~ )
Data: April 19 2020 SummaryPage
Channel List: Aux yuzu_dqchlist_20200419.txt | Main: K1:CAL-CS_PROC_C00_STRAIN_DBL_DQ
- Observing Information:
Inspiral Range Plot |
Detector Sensitivity |
Omicron Glitch Gram |
|
|
|
- Loudest events by SNR:
- 10 loudest K1:CAL-CS_PROC_C00_STRAIN_DBL_DQ (Omicron) events by SNR with minimum 8s separation. Launch omega scans
GPS time |
UTC time |
Duration |
Peak frequency |
Central freq. |
Bandwidth |
SNR |
GPS_start |
GPS_end |
Sam_Rate |
TStride |
FStride |
# of Samples |
Run Check |
Analyzed Results |
1271311593.609 |
April 19 2020 06:06:15.609 |
0.031 |
121.192 |
121.195 |
1.723 |
288.743 |
1271311586 |
1271311600 |
8192 |
2 |
7 |
16384/seg |
|
|
1271302217.998 |
April 19 2020 03:29:59.998 |
0.004 |
111.850 |
112.298 |
20.032 |
221.521 |
1271302210 |
1271302224 |
8192 |
2 |
7 |
16384/seg |
|
|
1271356741.438 |
April 19 2020 18:38:43.437 |
0.125 |
41.141 |
41.142 |
0.585 |
202.916 |
1271356734 |
1271356748 |
8192 |
2 |
7 |
16384/seg |
|
|
1271337318.002 |
April 19 2020 13:15:00.000 |
0.004 |
111.850 |
112.298 |
20.032 |
170.477 |
1271337311 |
1271337325 |
8192 |
2 |
7 |
16384/seg |
|
|
1271340918.001 |
April 19 2020 14:15:00.000 |
0.002 |
133.756 |
134.291 |
23.955 |
166.644 |
1271340911 |
1271340925 |
8192 |
2 |
7 |
16384/seg |
|
|
1271325225.998 |
April 19 2020 09:53:27.998 |
0.004 |
111.850 |
112.298 |
20.032 |
164.685 |
1271325220 |
1271325234 |
8192 |
2 |
7 |
16384/seg |
|
|
1271313018.002 |
April 19 2020 06:30:00.001 |
0.004 |
111.850 |
112.298 |
20.032 |
162.386 |
1271313011 |
1271313025 |
8192 |
2 |
7 |
16384/seg |
|
|
1271303583.984 |
April 19 2020 03:52:45.984 |
0.031 |
121.192 |
121.195 |
1.723 |
161.520 |
1271303576 |
1271303590 |
8192 |
2 |
7 |
16384/seg |
|
|
1271296947.422 |
April 19 2020 02:02:09.421 |
0.031 |
121.192 |
121.195 |
1.723 |
161.284 |
1271296940 |
1271296954 |
8192 |
2 |
7 |
16384/seg |
|
|
1271336417.998 |
April 19 2020 12:59:59.998 |
0.004 |
111.850 |
112.298 |
20.032 |
160.725 |
1271336410 |
1271336424 |
8192 |
2 |
7 |
16384/seg |
|
Working Paper
- JKPS Special Issue:


