|
Size: 106
Comment:
|
Size: 1148
Comment:
|
| Deletions are marked like this. | Additions are marked like this. |
| Line 2: | Line 2: |
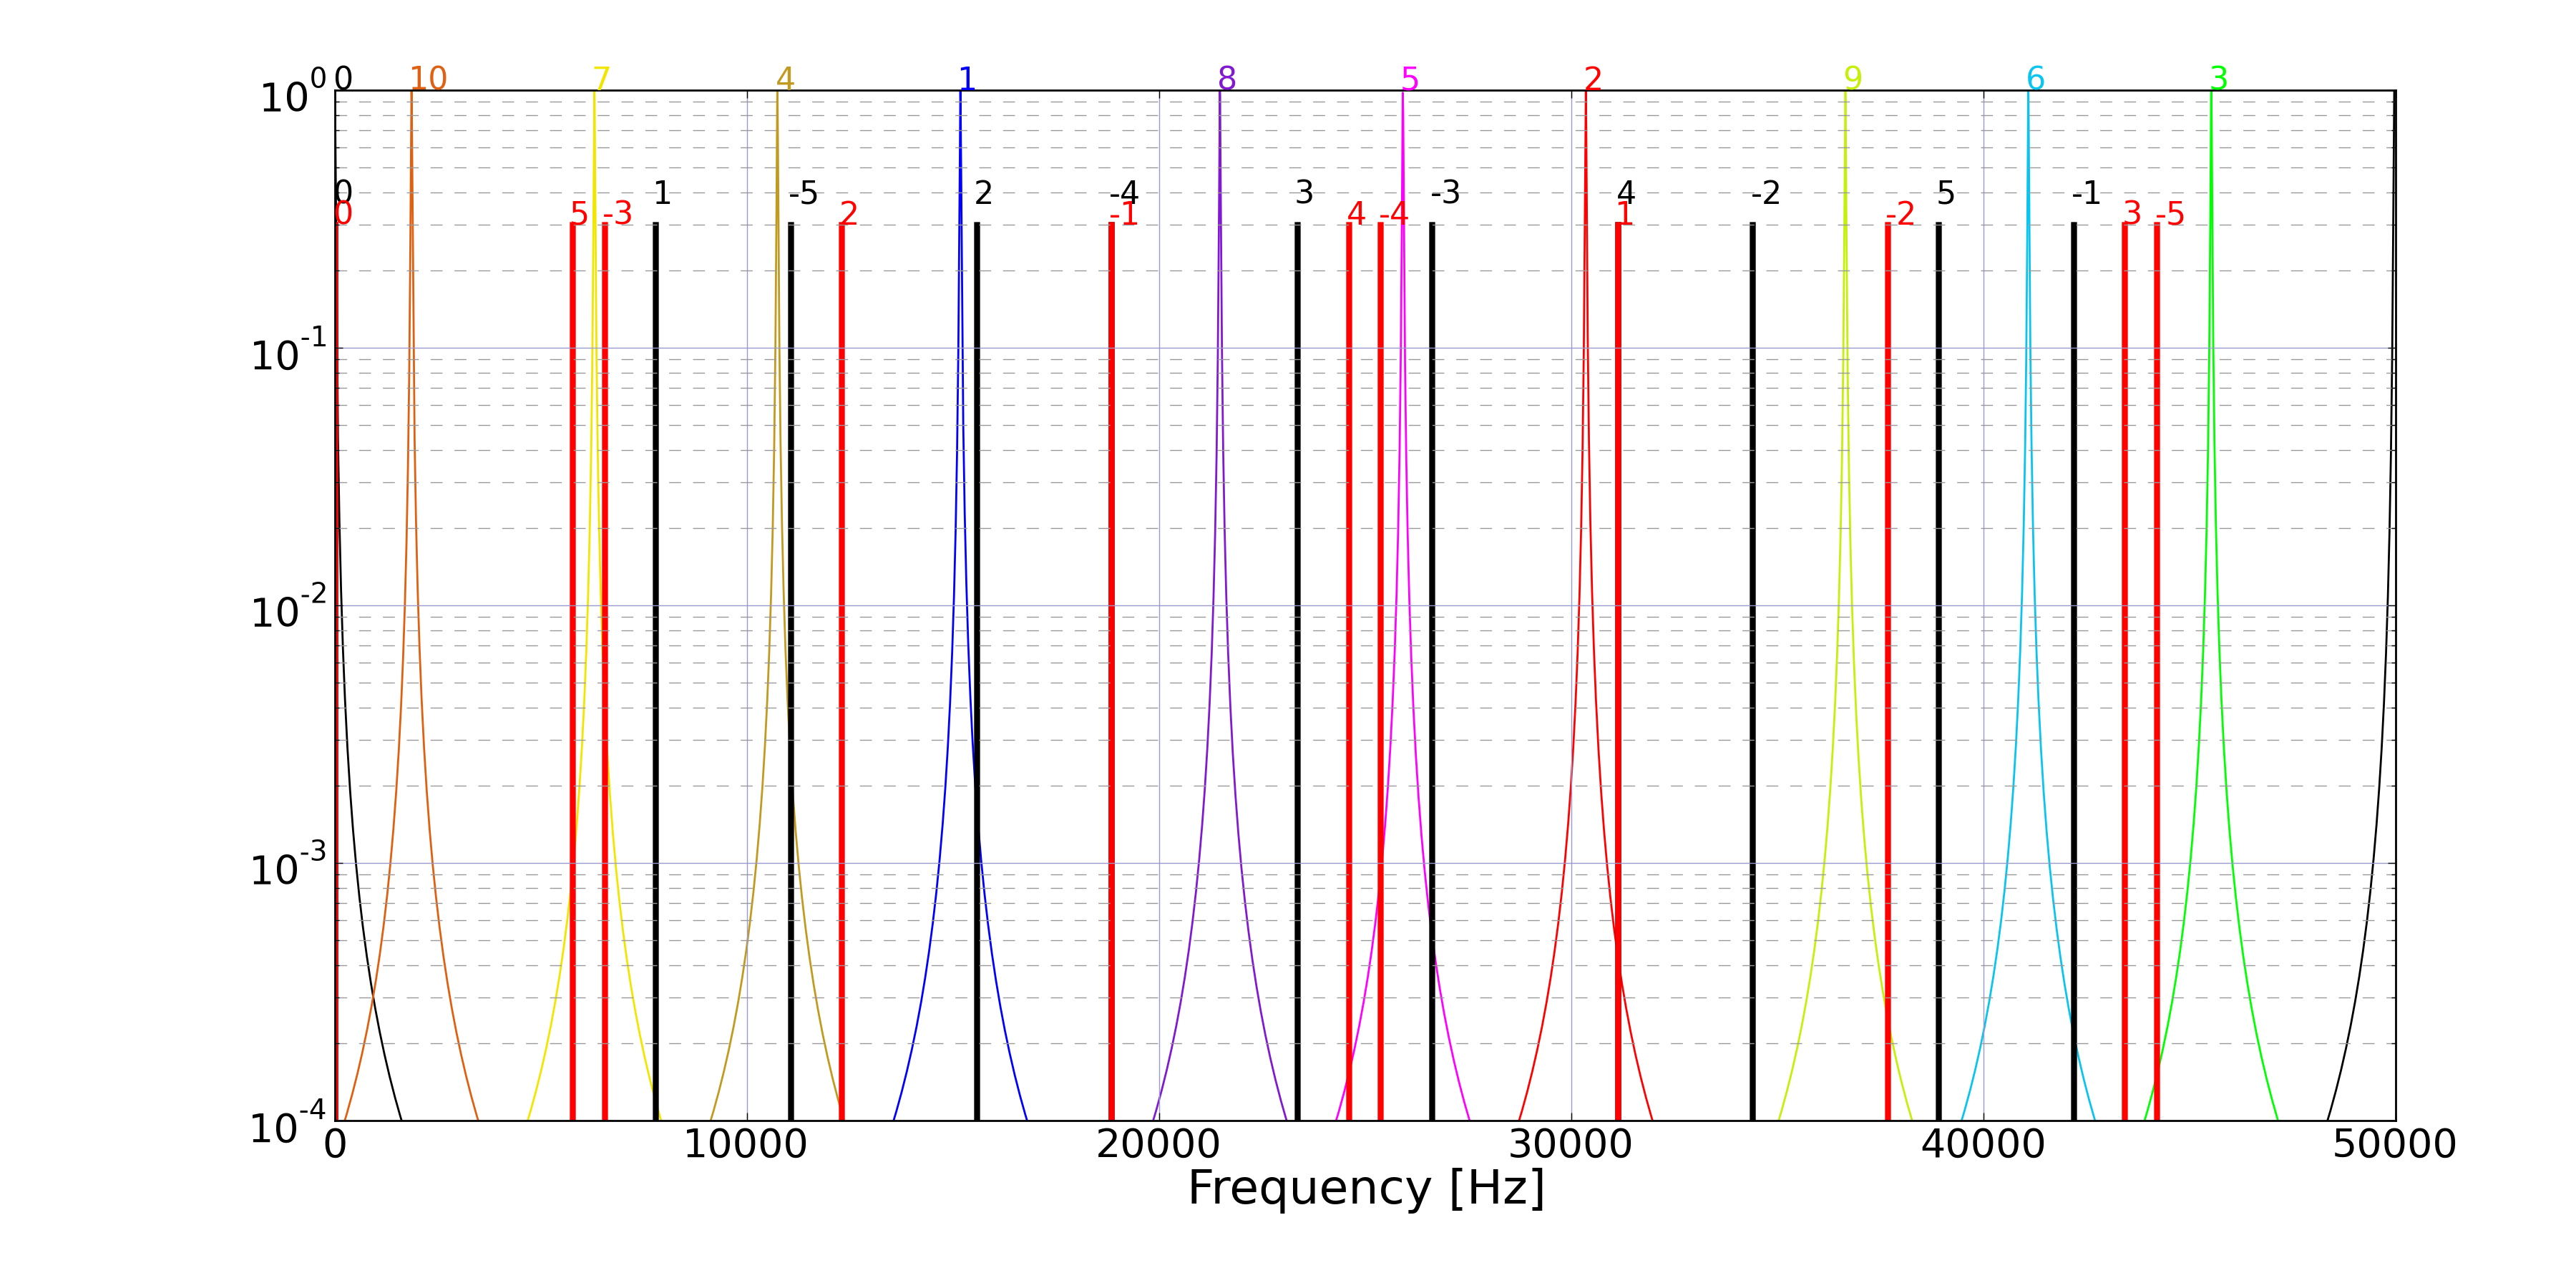
| FSR of the arm cavities and the RF sideband frequencies must be chosen so that the sidebands are non-resonant to the arm cavities. In addition, the higher order spatial modes of the arm cavities must not overlap with the RF sidebands. Otherwise, misalignments of the arms can resonate sidebands in the arms and introduce some instability or noise. == Relative locations of HOMs and sideband harmonics == The plot below shows the locations of sideband harmonics and the higher order mode resonances in an FSR.<<BR>> The colorful curves with sharp peaks are resonant curves of the HOMs. The numbers at the top shows the order of the modes. If it is 5, it indicates the TEMnm modes with n+m=5.<<BR>> The vertical lines show the sidebands and their harmonics. The black lines are the harmonics of f1(=11.25MHz) sidebands. The red lines are for f2(=45MHz). The numbers above the lines indicates the order of harmonics. For example, +/-1 are the upper and lower 1st order sidebands. {{attachment:HOMCheck3000d00.png||width=1000}} |
Higher order mode check
FSR of the arm cavities and the RF sideband frequencies must be chosen so that the sidebands are non-resonant to the arm cavities. In addition, the higher order spatial modes of the arm cavities must not overlap with the RF sidebands. Otherwise, misalignments of the arms can resonate sidebands in the arms and introduce some instability or noise.
Relative locations of HOMs and sideband harmonics
The plot below shows the locations of sideband harmonics and the higher order mode resonances in an FSR.
The colorful curves with sharp peaks are resonant curves of the HOMs. The numbers at the top shows the order of the modes. If it is 5, it indicates the TEMnm modes with n+m=5.
The vertical lines show the sidebands and their harmonics. The black lines are the harmonics of f1(=11.25MHz) sidebands. The red lines are for f2(=45MHz). The numbers above the lines indicates the order of harmonics. For example, +/-1 are the upper and lower 1st order sidebands.

https://granite.phys.s.u-tokyo.ac.jp/svn/LCGT/trunk/isc/OptConf/CheckHOM/
