Higher order mode check
FSR of the arm cavities and the RF sideband frequencies must be chosen so that the sidebands are non-resonant to the arm cavities. In addition, the higher order spatial modes of the arm cavities must not overlap with the RF sidebands. Otherwise, misalignments of the arms can resonate sidebands in the arms and introduce some instability or noise.
Check if transverse mode spacing is appropriate
First, we check if the transverse mode spacing for our g-factor is reasonable so that most HOM won't resonate in the cavity.
Parameters
L = 3000.06m R1 = 7114m R2 = 7114m g1 = g2 = 0.5783 gamma = 0.30372
gamma is the transverse mode spacing (relative to FSR).
Plot
The ratio between the intra-cavity power of the HOMs and the TEM00 mode is plotted as a function of the mode number.
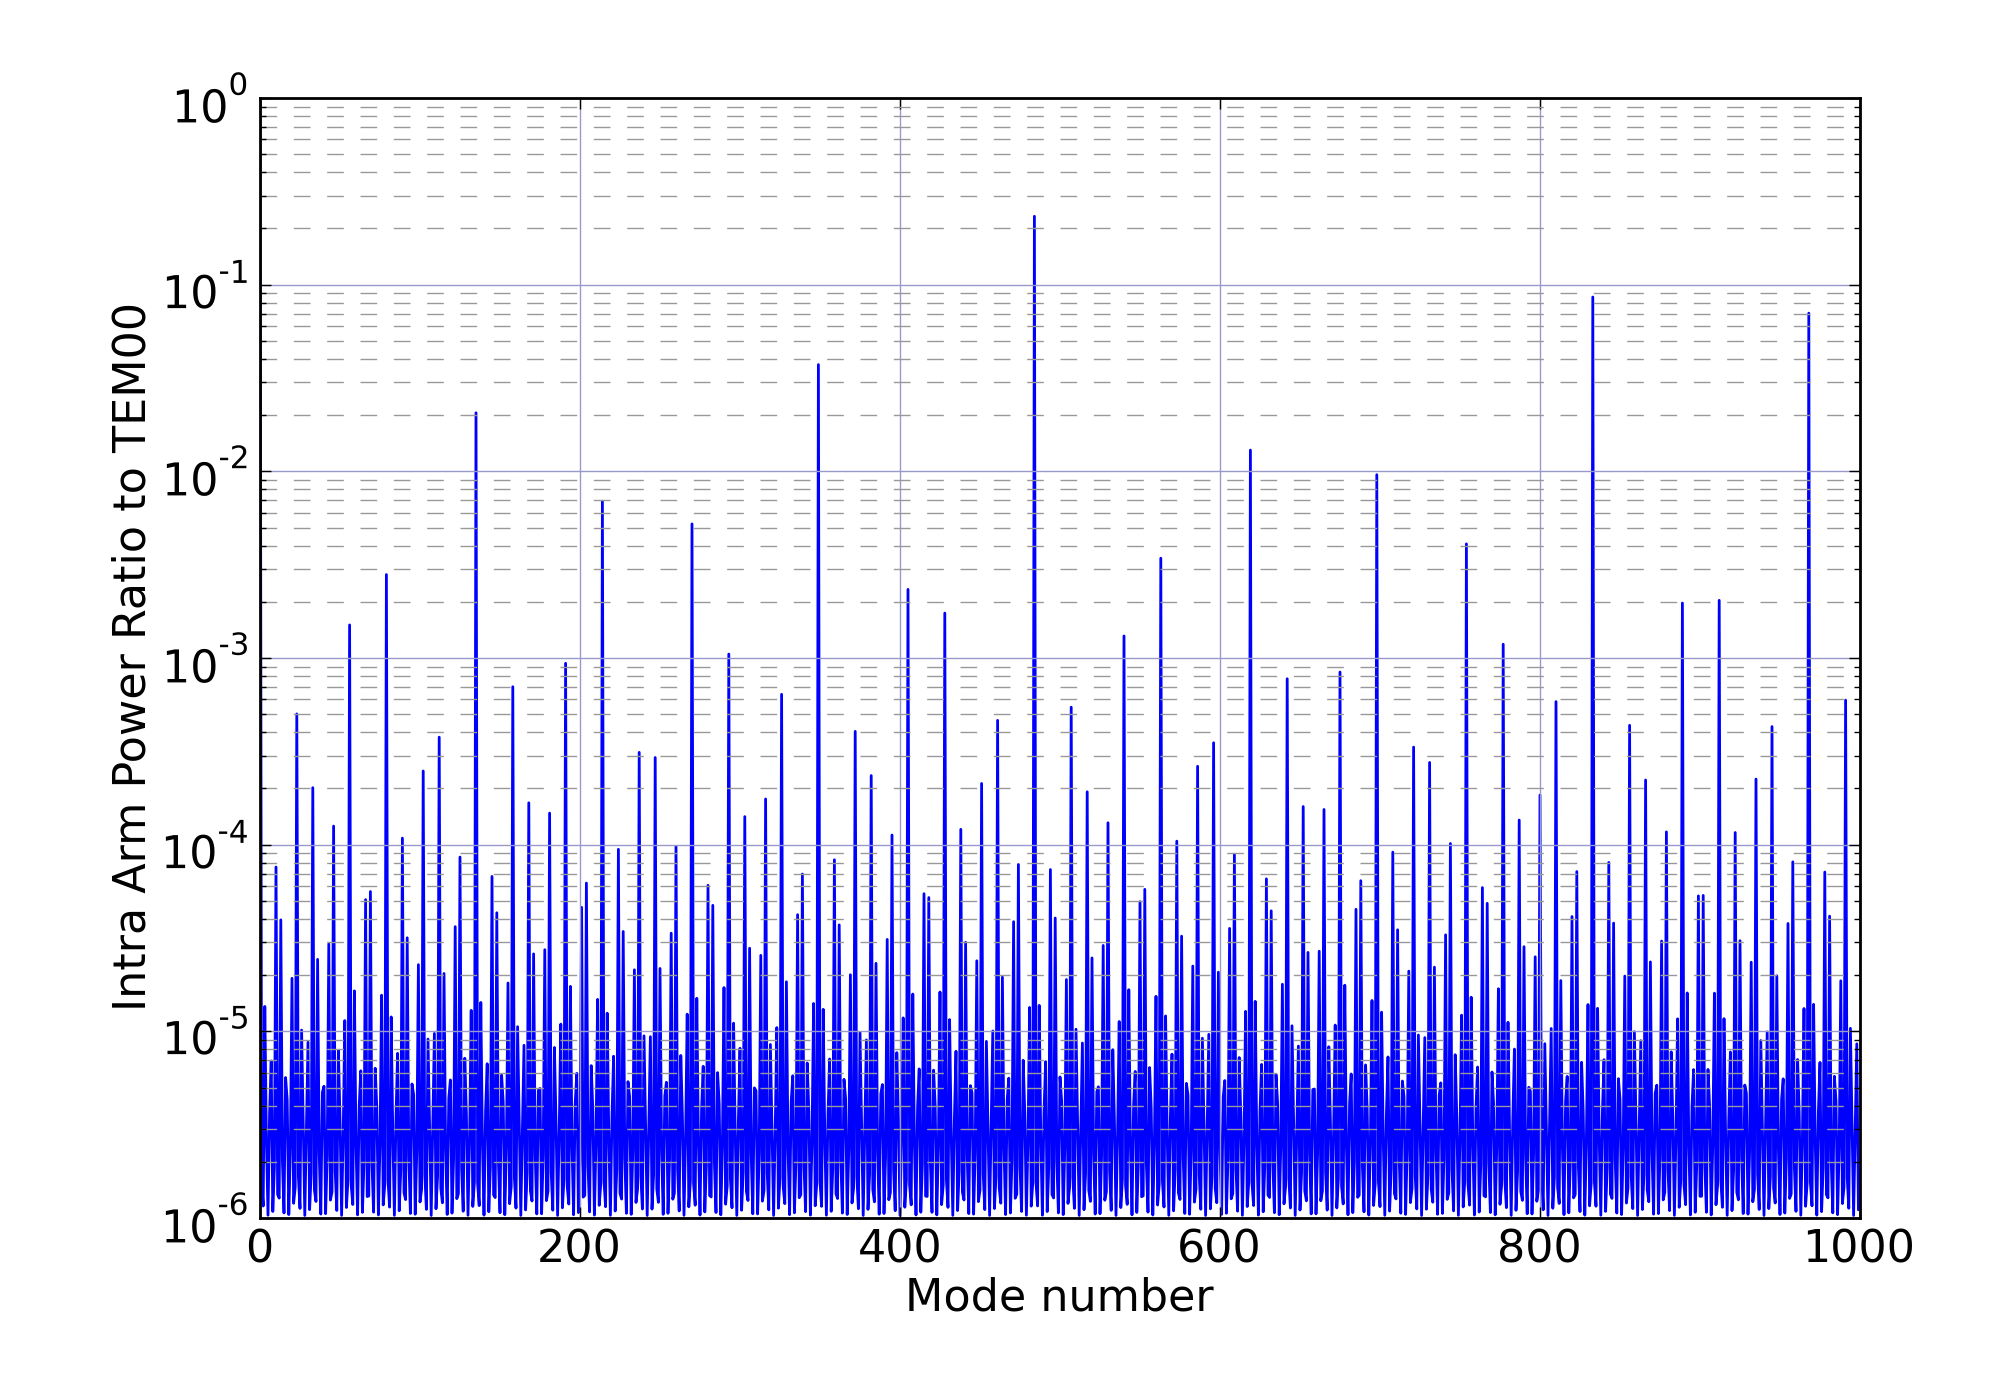
The HOM power gain in the cavity is less than 1% of the carrier until n+m=135.
Relative locations of HOMs and sideband harmonics
The plot below shows the locations of sideband harmonics and the higher order mode resonances in an FSR.
The colorful curves with sharp peaks are resonant curves of the HOMs. The numbers at the top shows the order of the modes. If it is 5, it indicates the TEMnm modes with n+m=5.
The vertical lines show the sidebands and their harmonics. The black lines are the harmonics of f1(=11.25MHz) sidebands. The red lines are for f2(=45MHz). The numbers above the lines indicates the order of harmonics. For example, +/-1 are the upper and lower 1st order sidebands.
The resonant curves represents the power gain of the cavity normalized to 1 at the full resonance. The height of the sideband lines has no meaning.
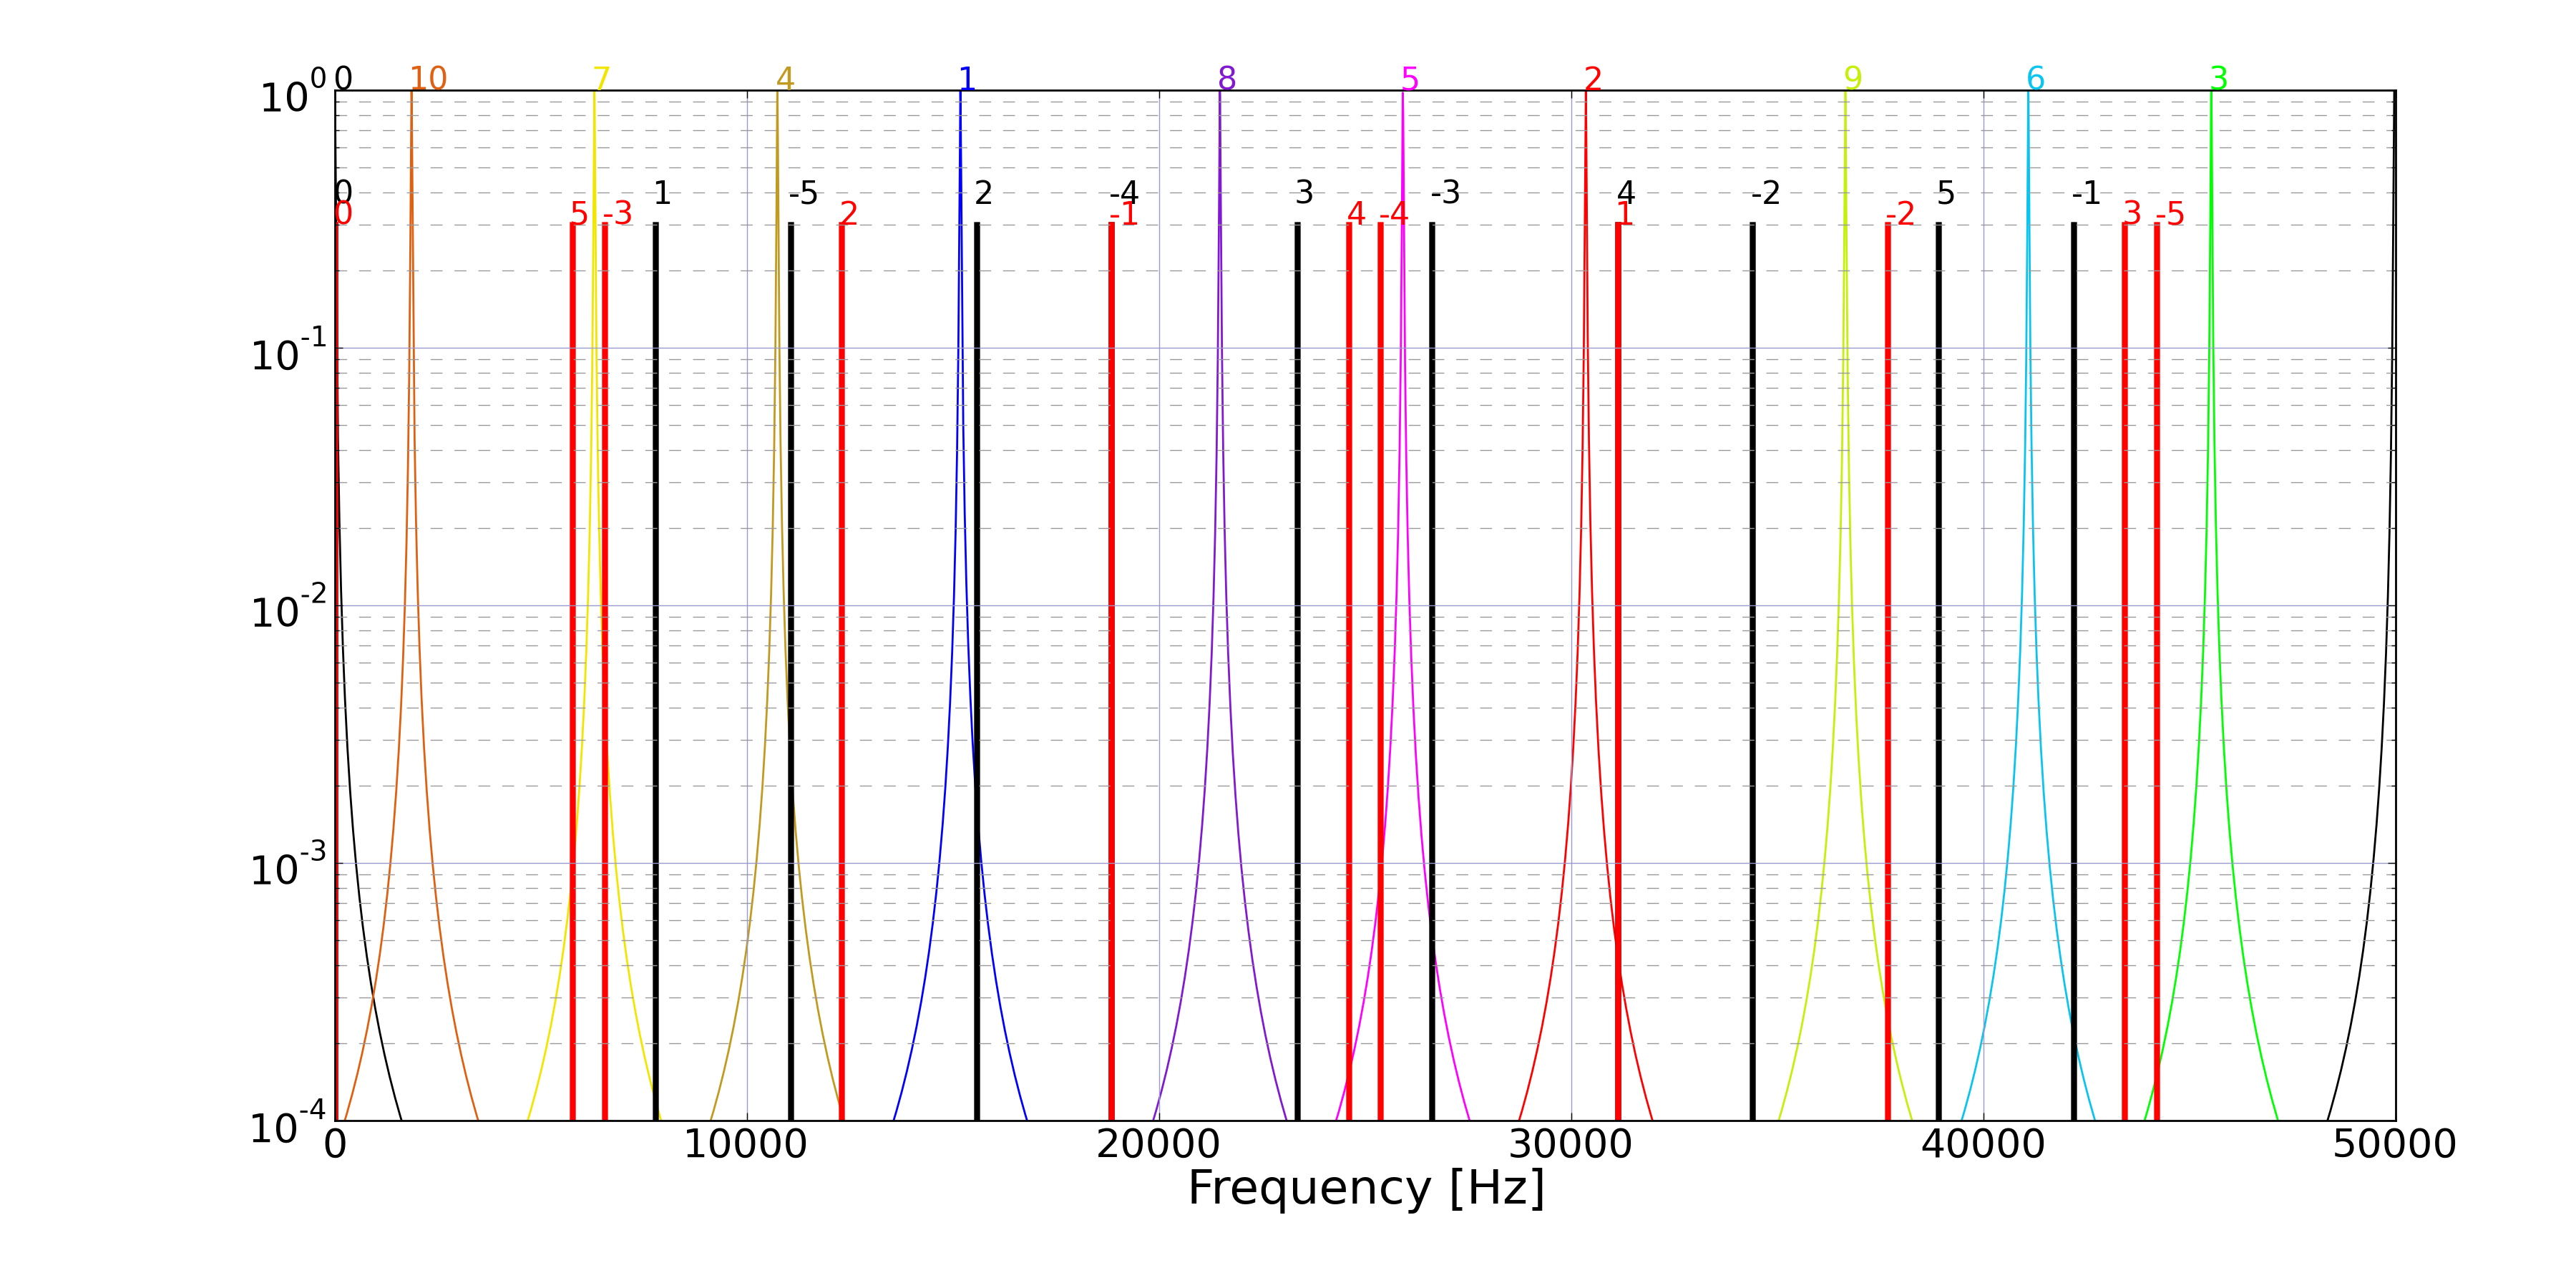
Actually, this does not look so bad. However, we may want to move the 2nd harmonics of f1 away from the 1st order HOMs.
Since the FSR is about 50kHz for L=3km and the RF sidebands are tens of MHz, the sidebands reside many FSRs away from the carrier. Therefore, the relative location of the sidebands to the carrier resonance strongly depends on the arm length L. It means L is the good parameter to play with. The above plot is made with exactly L=3000.0m.
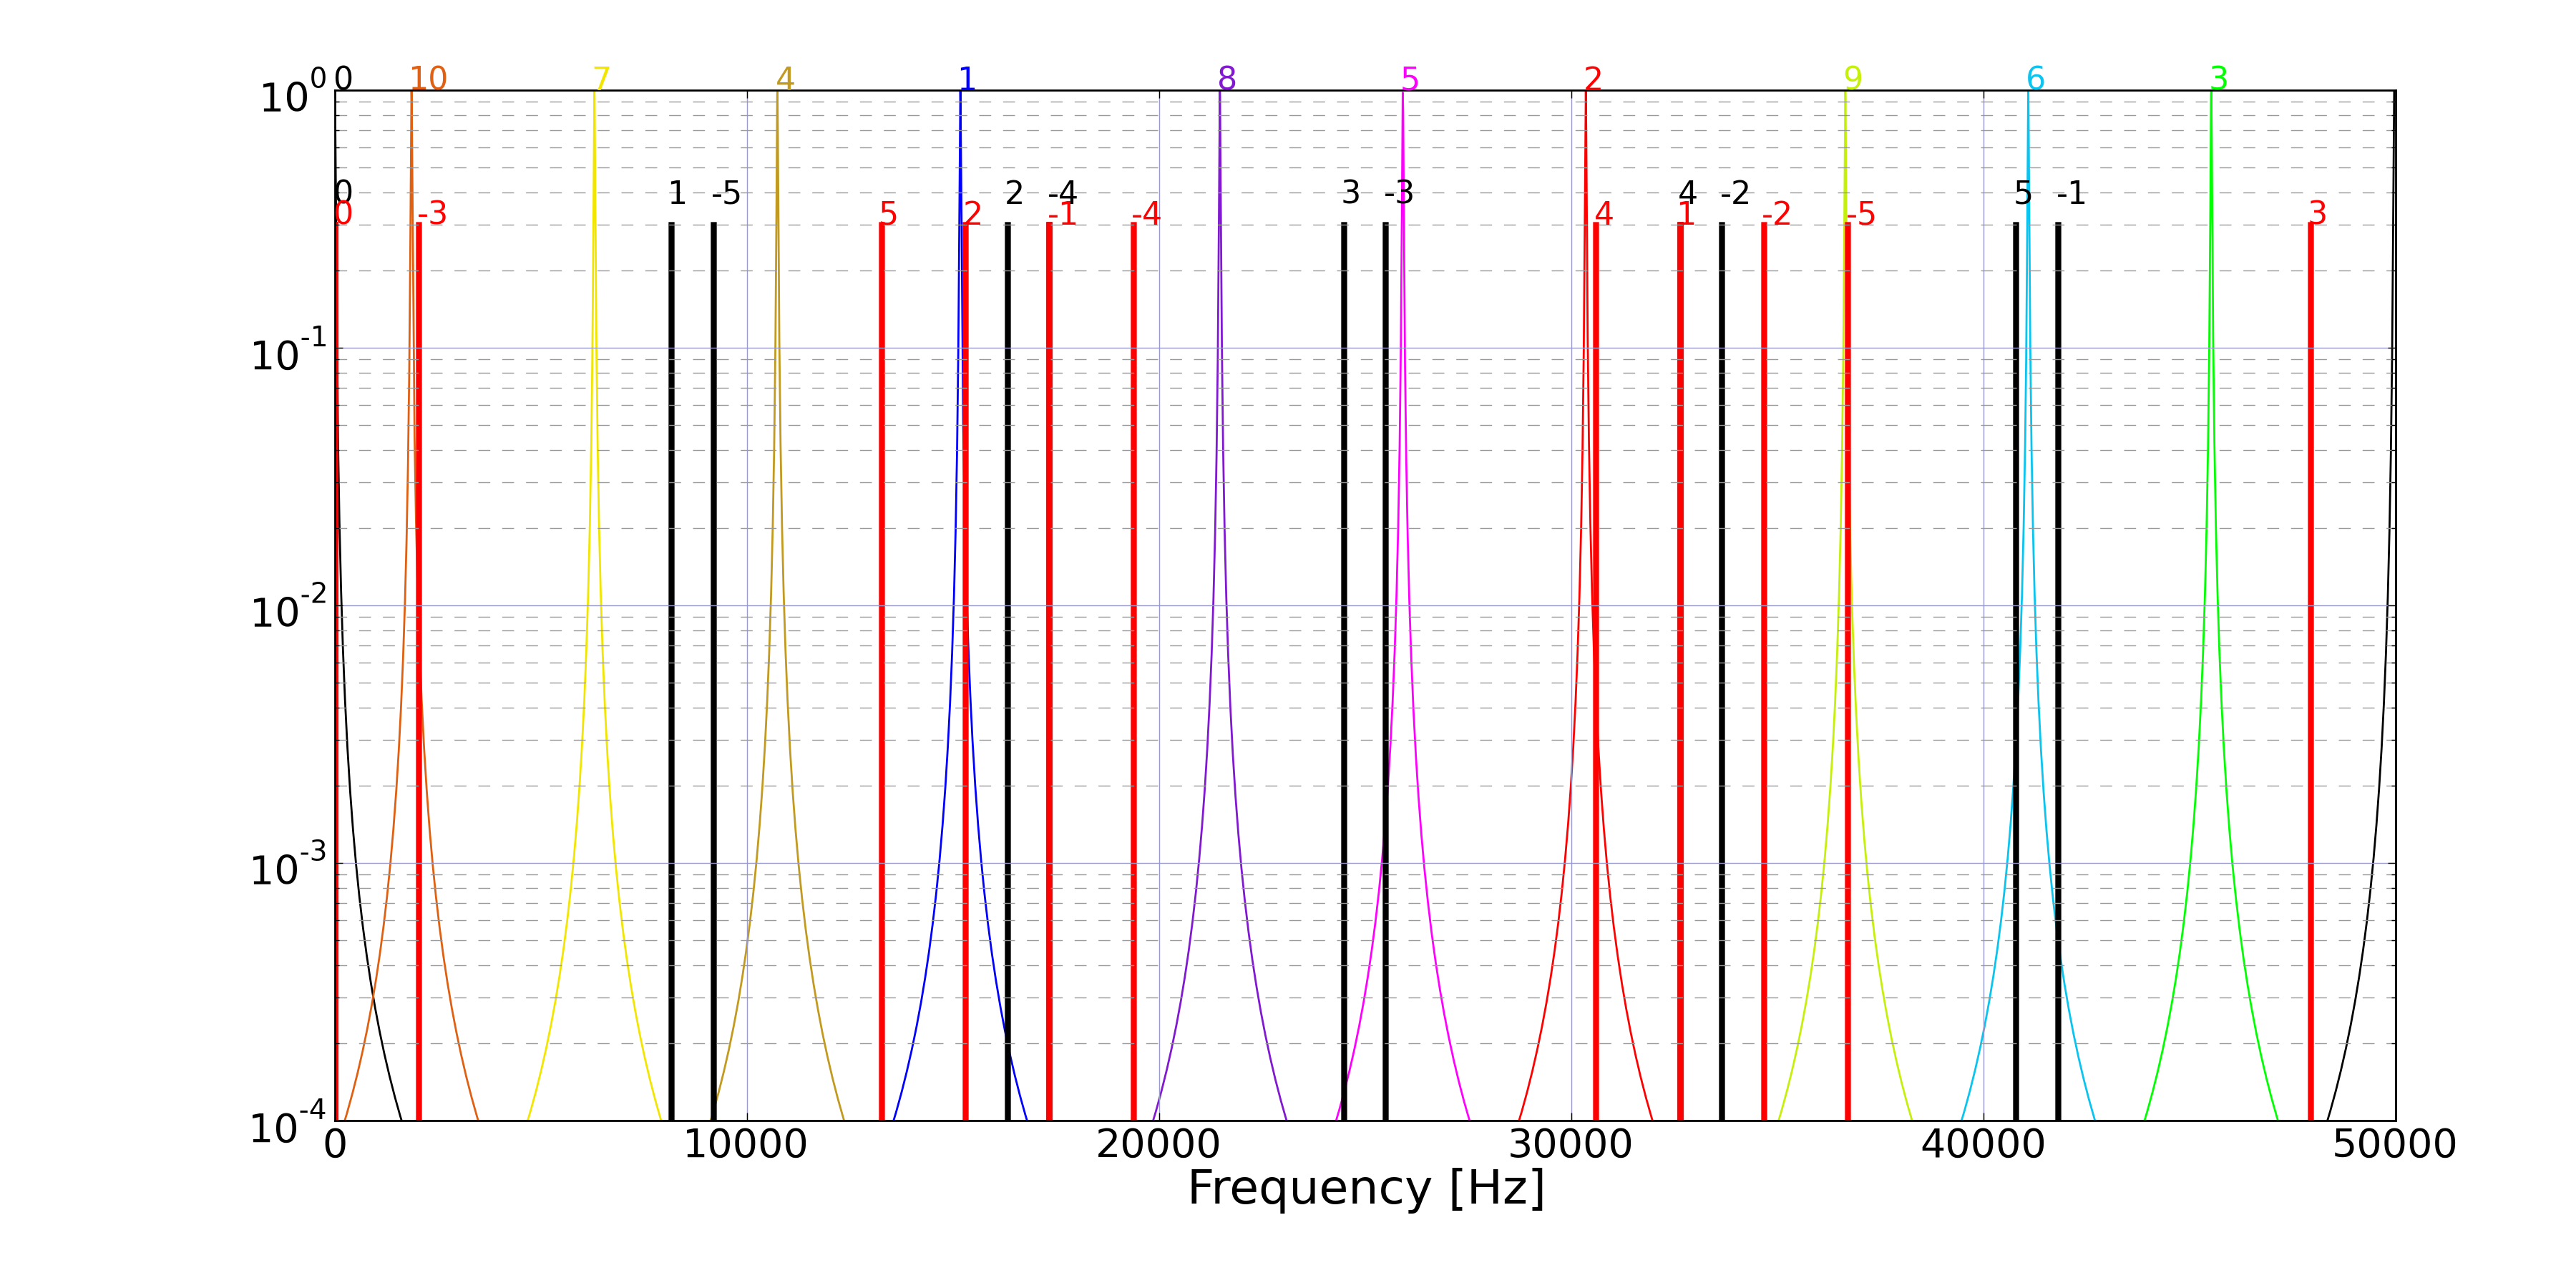
The plot below shows when L=3000.10m. Now the 2nd f2 sideband is very close to the 1st order HOMs.
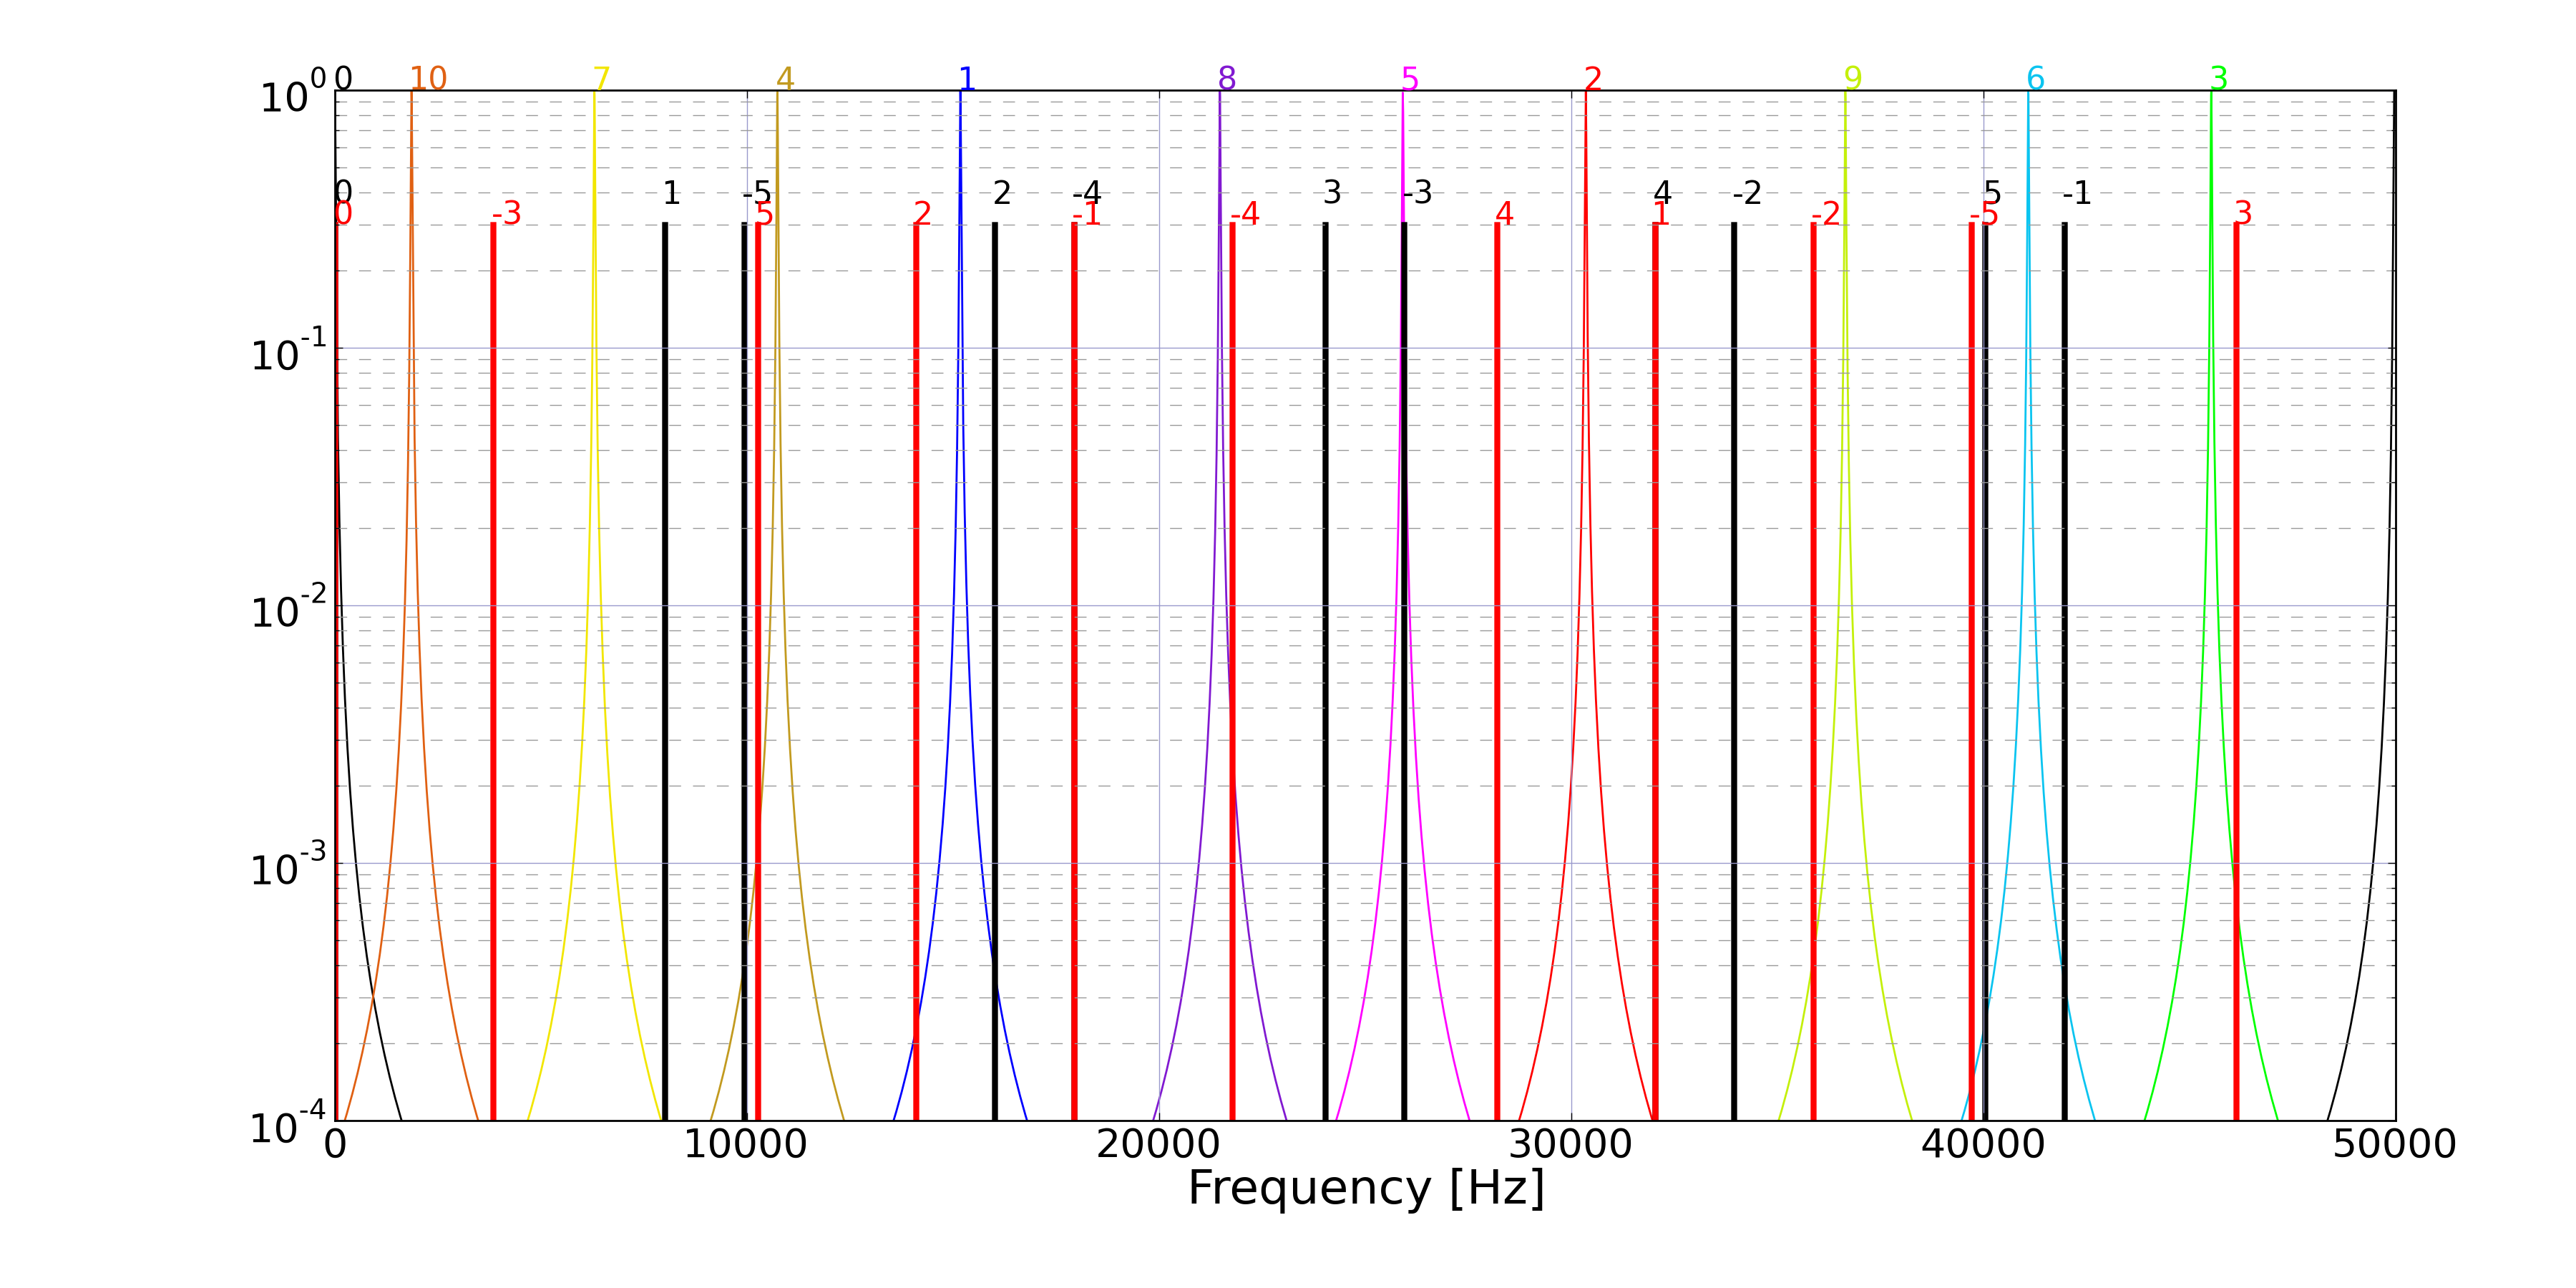
Now, we reduce the length by 4cm. Here is the plot of L=3000.06m. It seems reasonable except for the -3rd f1 and 5th HOMs overlap. The 3rd order harmonics is so small that it won't be a problem.
Maximum sideband resonance
In order to find the optimal arm length L, the maximum overlap between the sideband harmonics and the HOMs is plotted as a function of L in the following plot.
In order to create this plot, the products of the normalized arm power gains of the HOMs and the sideband power (J(n,0.1)^2 for n-th harmonics) were calculated for every combinations of HOMs and sideband harmonics. The modulation depth is assumed to be 0.1. The product is close to 1 for the carrier resonating in the cavity. Then the maximum of the products was picked and plotted in the graph. This process was repeated for various values of L to get the following graph.
Note that the coupling coefficients of the HOMs and the sidebands are ignored (i.e. just 1 for all HOMs), which is not true. Usually higher order modes have far less coupling to the incoming beam than the fundamental mode. So, the plot below gives an upper limit to the HOM-sideband coupling.
The horizontal axis of the plot below is the offset of L from 3000.0m (in cm).
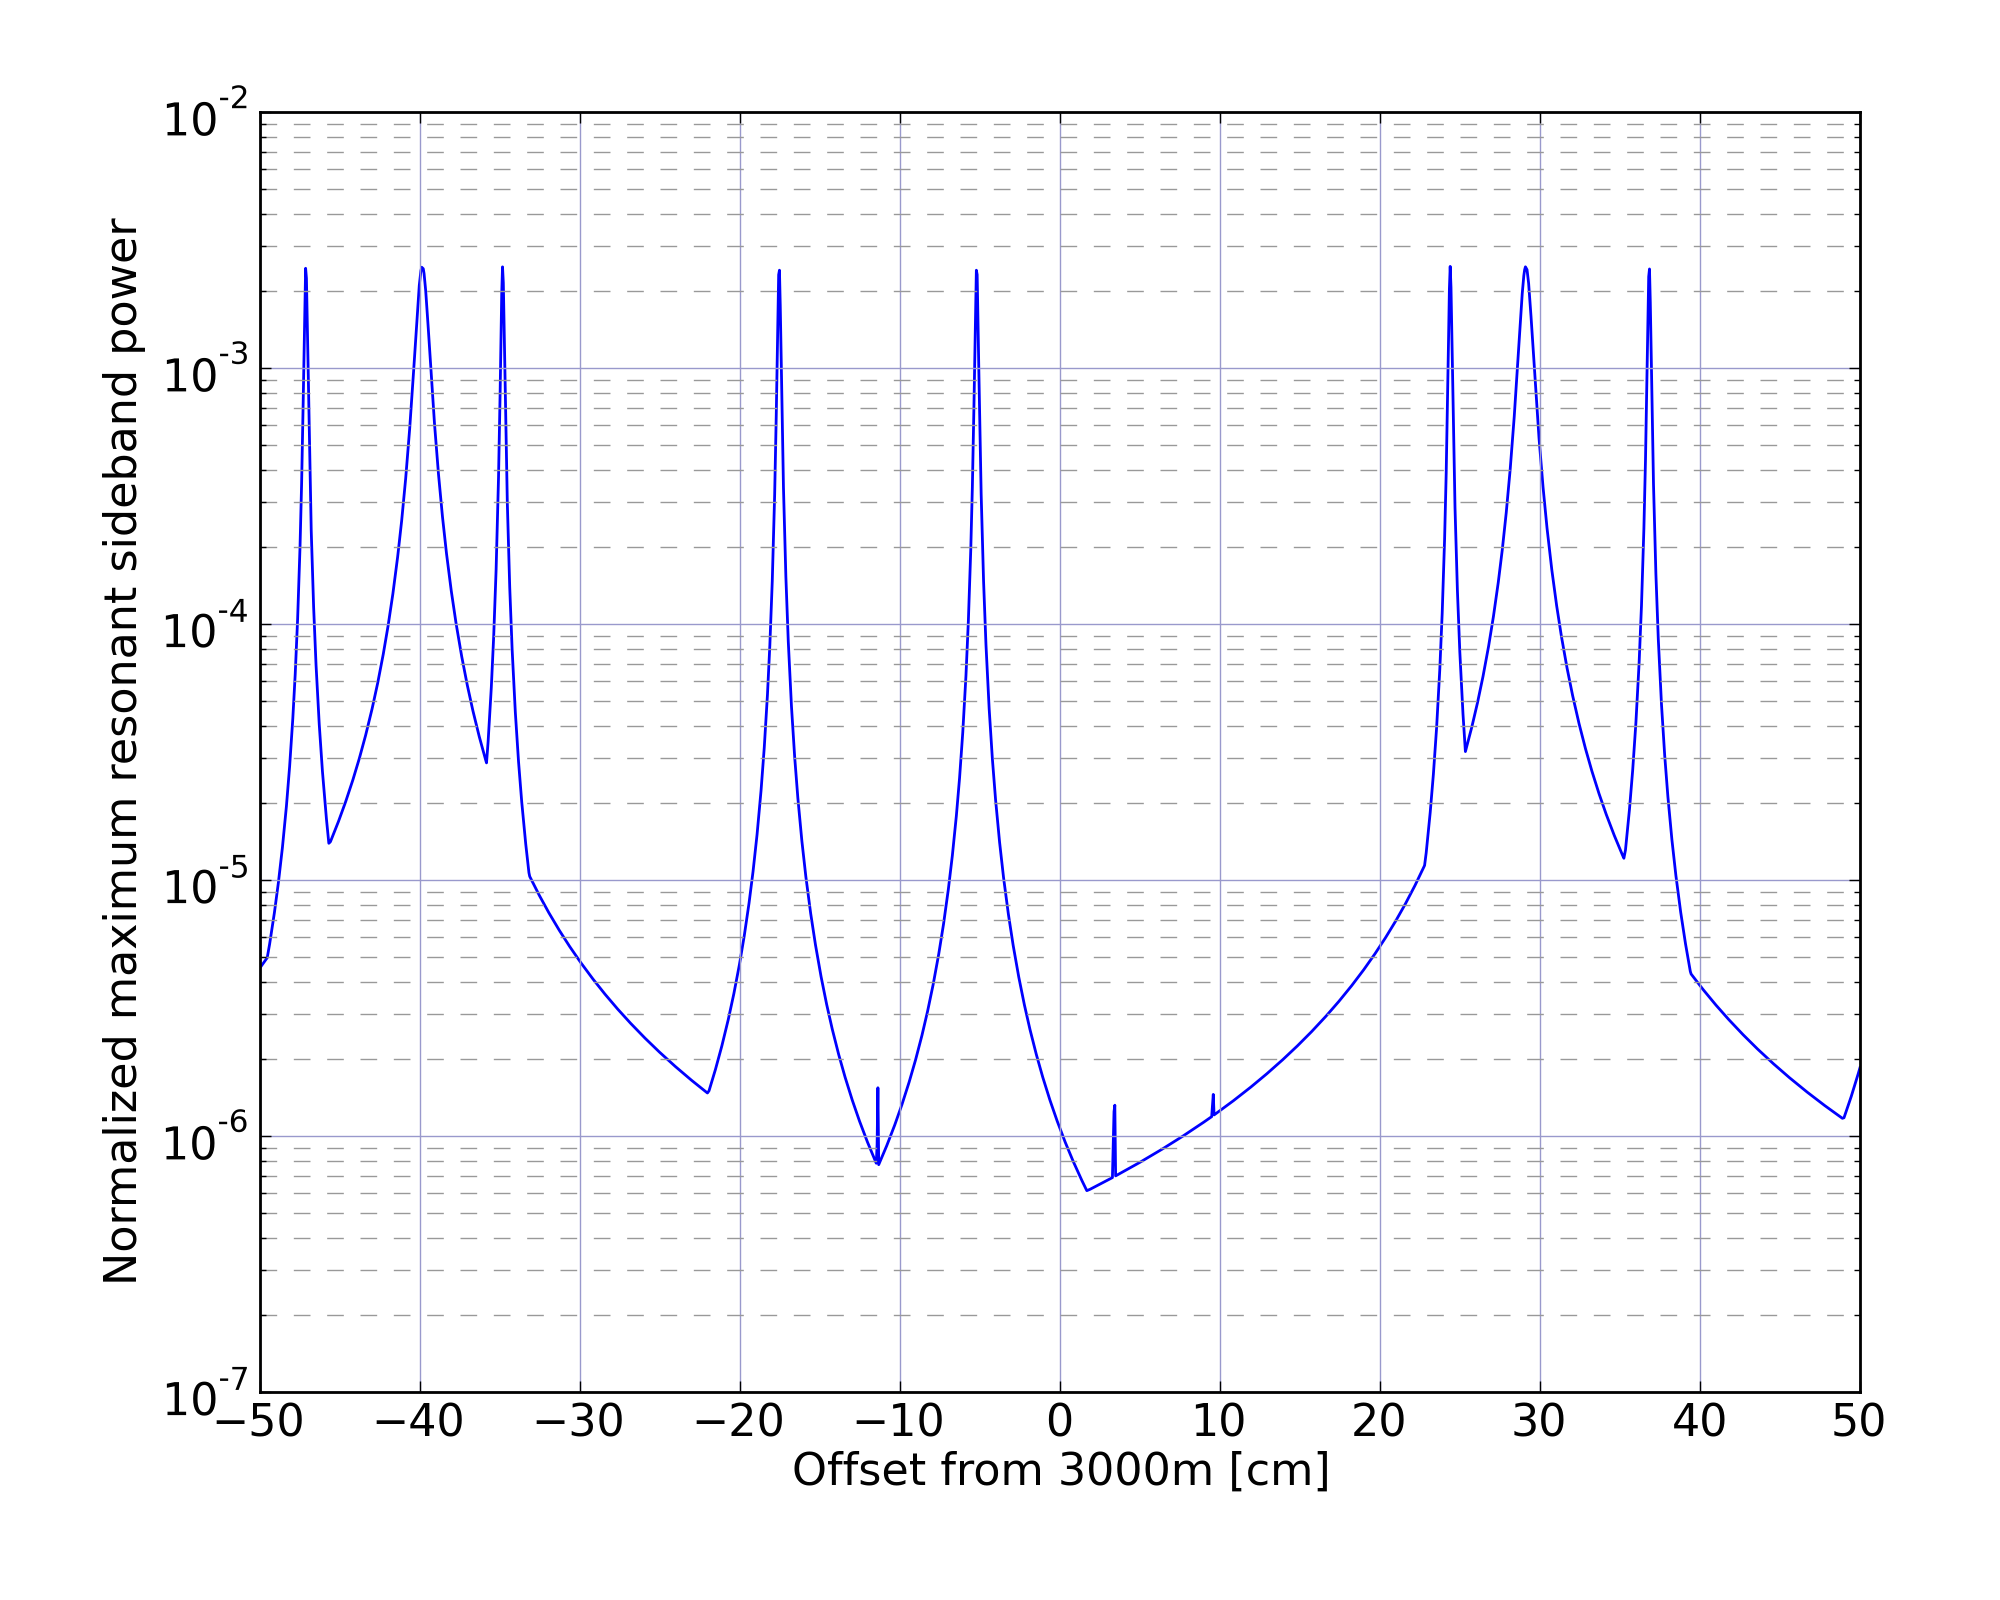
From the plot above, it seems to be reasonable to choose 3000.06m as the arm cavity length.
Changing MC Length
In the above discussions, we only changed the arm lengths. However, the sideband frequencies can be easily changed by changing the MC length. So it is probably a better idea to change the MC length rather than the arm length.
The current MC length is set to have the FSR of half the f1 frequency
- Lmc = 2*c/(2*f1)
Therefore,
f1 = c/Lmc
df1/dLmc = -c/Lmc^2
The following plot shows the same plot as the above but Lmc as horizontal axis.
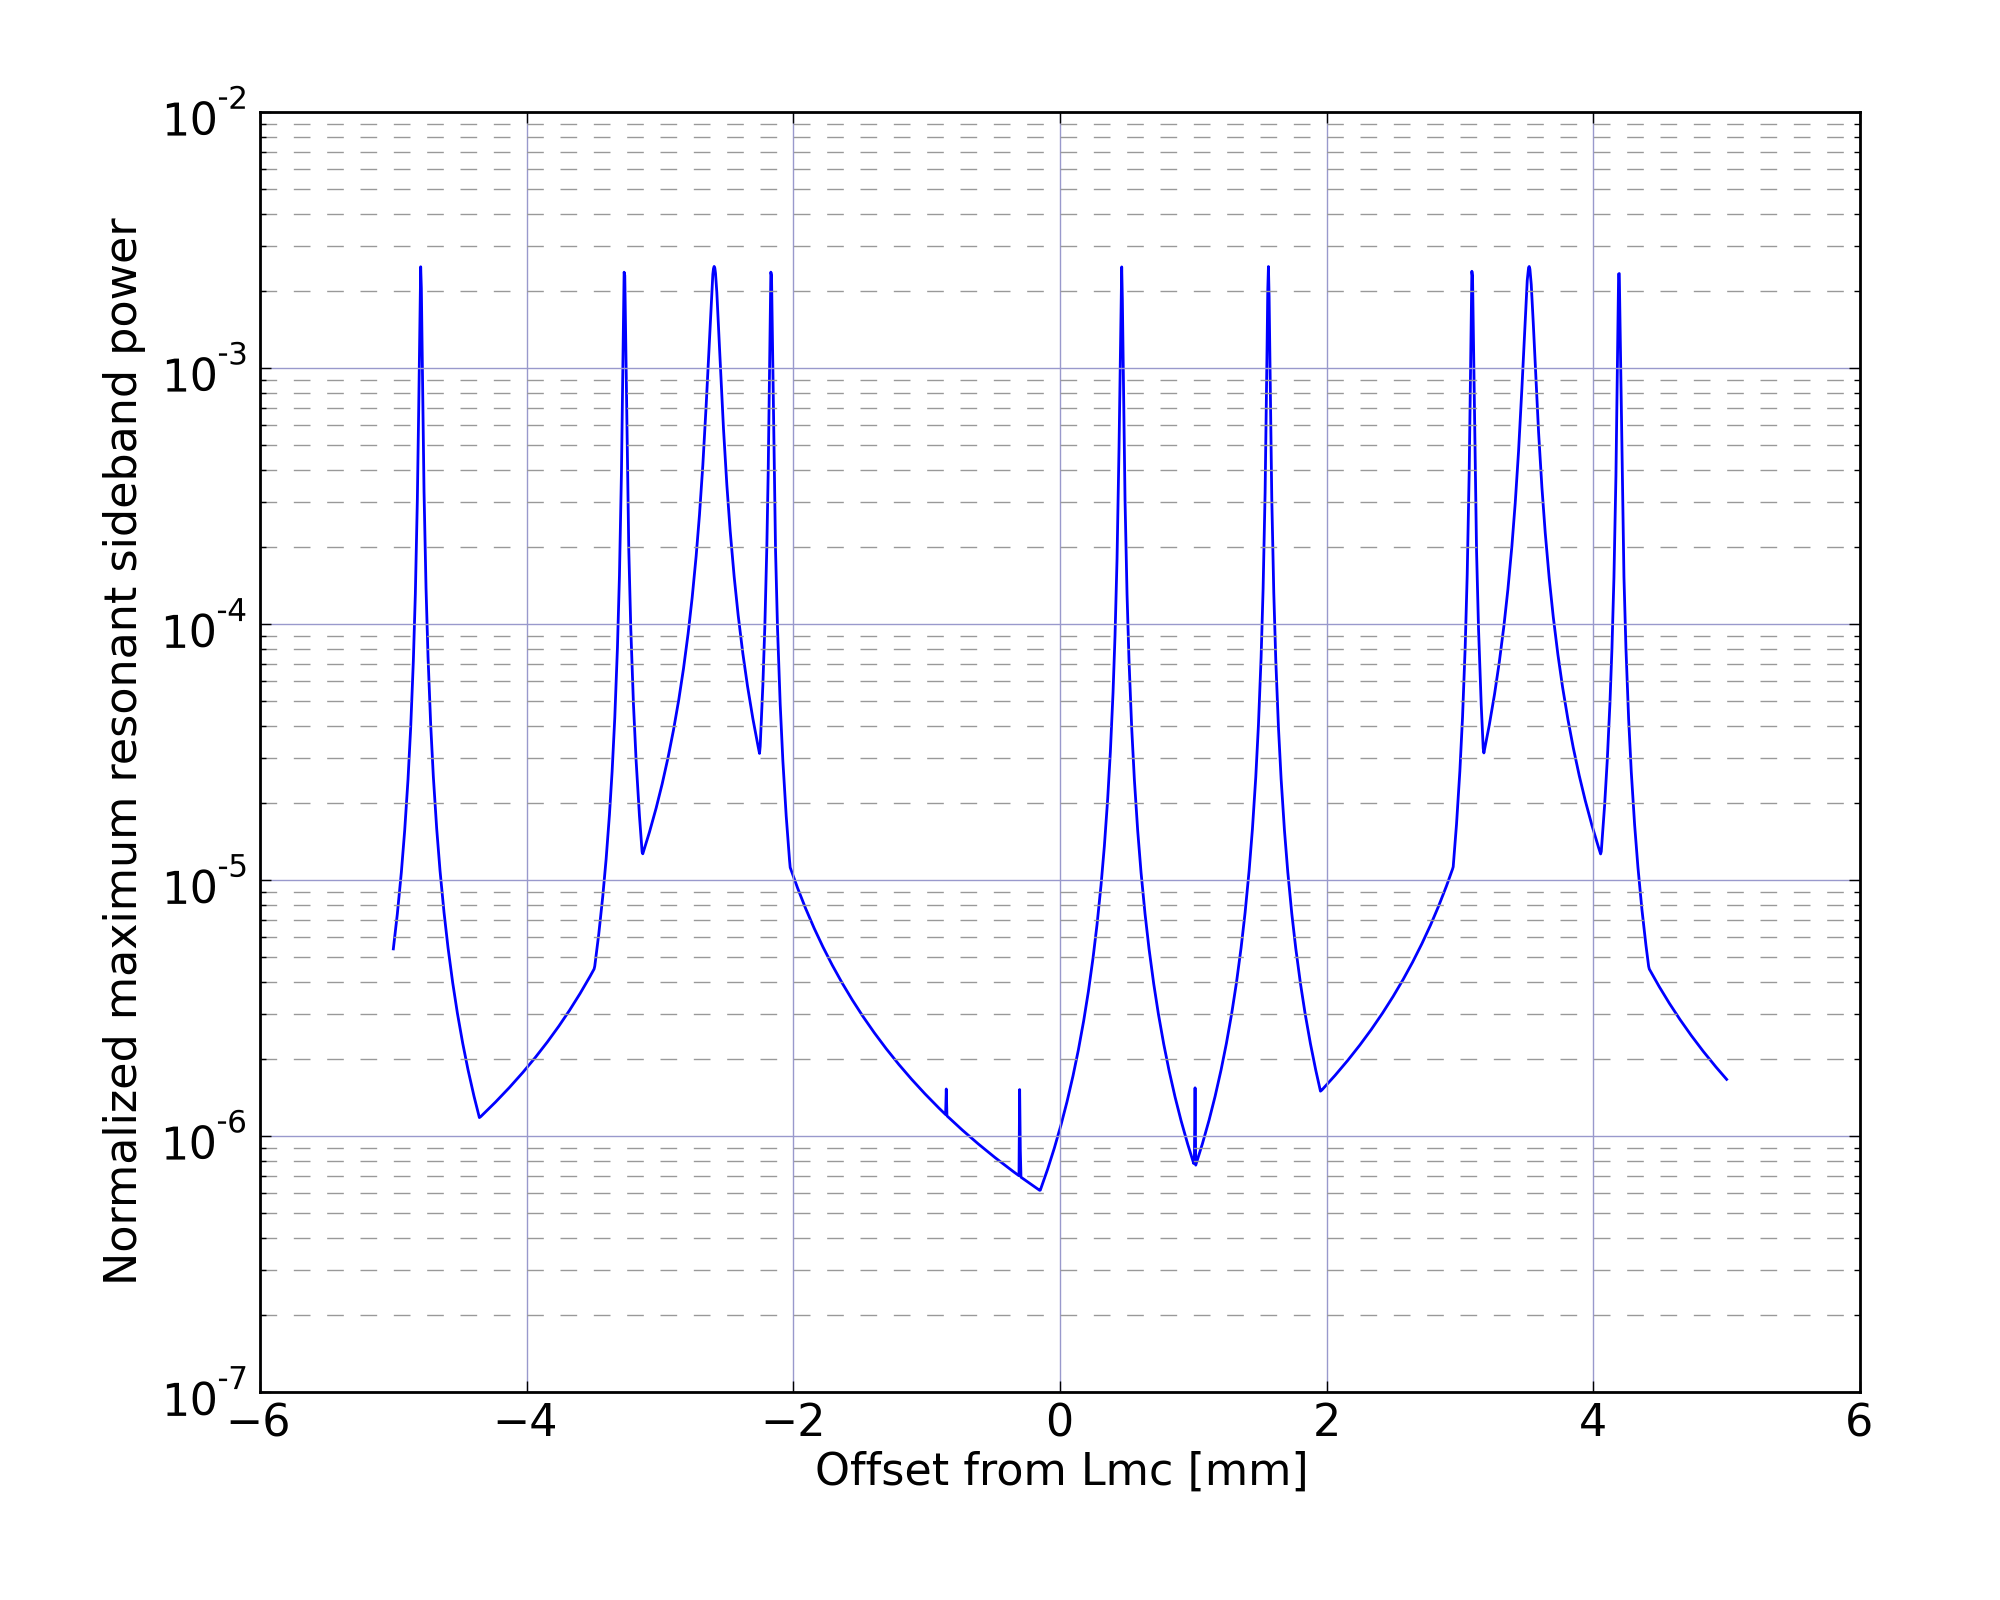
It seems that at most +/-2mm change in MC length is enough to escape from bad luck.
Changing f1 frequency requires us to also change the PRC and SRC lengths. Lprc is set so that the f1 frequency is 5.5 times the PRC FSR.
Lprc = 5.5*c/(2*f1) = 5.5/2 * Lmc
Therefore, Lprc must be changed by 2.25 times the change in Lmc. It is the same for Lsrc.
Overall, the required length change is on the order of mm. So we may just be able to achieve these changes by adding some offset to the suspensions. Not sure.
Codes
The above plots were all created by a python script. It can be obtained from the LCGT svn.
https://granite.phys.s.u-tokyo.ac.jp/svn/LCGT/trunk/isc/OptConf/CheckHOM/
Instructions on how to use python for scientific computing can be found here.
