Step 5: Demodulate a calibration line
For the initialization and running the pipeline, please refer step1
Access frame cache file by specifying frame_cache and instrument as in step2
Define a frame multiplexer(mux) to write channels into a frame as in step3
- Here is an example of pipeline implementation for the demodulation part
   1 demod_rate  = 16 # compute_factors_sr in Hz
   2 demod_filt  = 20 # demodulation_filter_time in second
   3 line_freq   = 15 # line_freq
   4 td          = True  # Using time-domain filter
   5
   6 compute_factors_sr     = 1   # Output sampling rate in Hz
   7 factors_averaging_time = 10  # factors_averaging_time in second
   8 median_smoothing_time  = 128 # median_smoothing_time in second
   9
  10 integ_samples   = int(demod_filt) * demod_rate
  11 fac_ave_samples = int(factors_averaging_time) * demod_rate
  12 med_smt_samples = int(median_smoothing_time)  * demod_rate
  13
  14 ###
  15
  16 cin = cp.hook_up(pipeline, demux, chan_in, instrument, buf_length)
  17 cin = cp.caps_and_progress(pipeline, cin, capsf, "input")
  18
  19 cin_line = cp.demodulate(pipeline, cin, line_freq, td, capsz, integ_samples)
  20 rline,iline = cp.split_into_real(pipeline, cin_line)
  21
  22 rlsq = pp.mkpow(pipeline, rline, exponent = 2)
  23 ilsq = pp.mkpow(pipeline, iline, exponent = 2)
  24 kapp = cp.mkadder(pipeline, cp.list_srcs(pipeline, [rlsq, queue], [ilsq, queue]))
  25 kapp = pp.mkpow(pipeline, kapp, exponent = 0.5)
  26
  27 skp  = pp.mkgeneric(pipeline, kapp, "lal_smoothkappas",\
  28                     default_kappa_re = 0, default_kappa_im = 0,\
  29                     array_size = med_smt_samples,\
  30                     avg_array_size = fac_ave_samples, default_to_median = 1)
  31
  32 skp  = cp.mkresample(pipeline, skp, 0, False, capsl)
  33
  34 pp.mknxydumpsink(pipeline, skp, options.output)
- The python script is available at git repository
> kagra-cal/Observation/Phase1/tutorials/demod --help
Usage: demod [options]

Options:
  -h, --help            show this help message and exit
  --cache=cache         Set the name of the LAL cache listing the frame files
  --gps-start-time=seconds
                        Set the start time of the segment to analyze in GPS
                        seconds.
  --gps-end-time=seconds
                        Set the end time of the segment to analyze in GPS
                        seconds.
  --ifo=name            Name of the IFO (default= K1)
  --channel=name        Set input channel name (default= CAL-
                        CS_PROC_MICH_DELTA_TM_DQ)
  --line-freq=freq      Set line frequency to demodulate (default= 15)
  --output=name         Set output file name (default= line.txt)
  --ch-rate=rate        Set input channel data rate (default= 16384)
  --compute-factors-sr=Hz
                        Sample rate at which calibration factors are computed.
                        (Default = 16 Hz)
  --out-rate=rate       Set output data rate (default= 1)
  --demodulation-filter-time=sec
                        Length in seconds of low-pass FIR filter used in
                        demodulation of the calibration lines. (Default = 20
                        seconds)
  --factors-averaging-time=sec
                        Time (in seconds) over which to average the smoothed
                        time-varying calibration factors. (Default = 10
                        seconds)
  --median-smoothing-time=sec
                        Time (in seconds) to smooth out \kappas with a median-
like method. (Default = 128 s)- Here is an example to demodulate the 15Hz line at MICH_DELTA_TM channel with short demodulation, averaging and smoothing time (2 sec)
- Data in the first few seconds (depending on demodulation-filter-time) are 0
- Data for another few seconds (depending on factors-averaging-time and median-smoothing-time) should be also skipped
> kagra-cal/Observation/Phase1/tutorials/demod --cache=k1.cache --line-freq=15 --demodulation-filter-time=2 --factors-averaging-time=2 --median-smoothing-time=2
GPS:  1209288320 1209288352
channel=  CAL-CS_PROC_MICH_DELTA_TM_DQ
line_freq=  15.0  demod_filt=  2
factors_averaging_time=  2  median_smoothing_time=  2
seeking GPS start and stop times ...
setting pipeline state to playing ...
set to playing successfully
running pipeline ...
progress_src_input (00:00:01): 1209288352 / 32 seconds (3779026100.0 %)
- Check the contents of the output file (line.txt). The results fluctuate a lot because of the short averaging time
> head line.txt
1209288329.000000000    0
1209288330.000000000    3.560465675995634e-12
1209288331.000000000    7.646600407236563e-12
1209288332.000000000    8.539456647868739e-12
1209288333.000000000    8.575756283841539e-12
1209288334.000000000    7.98591111548684e-12
1209288335.000000000    7.453681848598155e-12
1209288336.000000000    7.295988171755139e-12
1209288337.000000000    8.008110390651456e-12
1209288338.000000000    8.639079959287761e-12
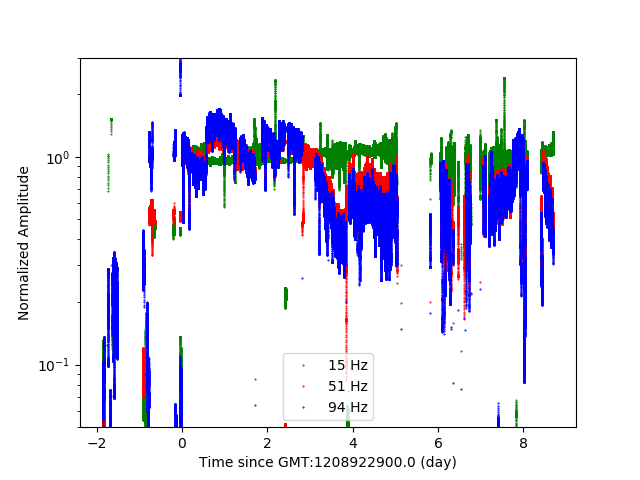
(Optional) Using frame files based on the lock flag in step 2 you can plot line amplitudes for the whole period of phase-1 run for example with MICH1_IN1 (MICH Error signal)
> kagra-cal/Observation/Phase1/tutorials/lines --dirn=demod --output=lines.png
freq,aref=  15 0.20679702541
freq,aref=  51 0.156144672263
freq,aref=  94 0.0959660527234

