Kagra VIS Operations Manual - data viewer
Note to self: do better screenshots
dataviewer is a standard CDS utility for displaying time series data from EPICS channels in real time and historically.
To invoke, type dataviewer& at a terminal prompt on a control room computer, or use one of the various shortcuts.
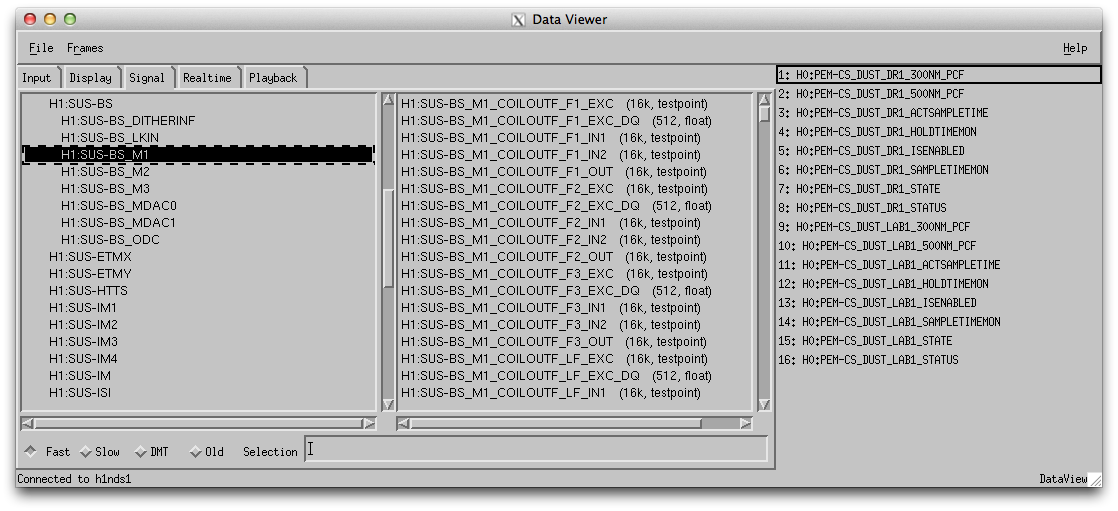
To set up a measurement, first go to the Signal tab and click on signal groups in the left hand list to drill down to the signals of interest:
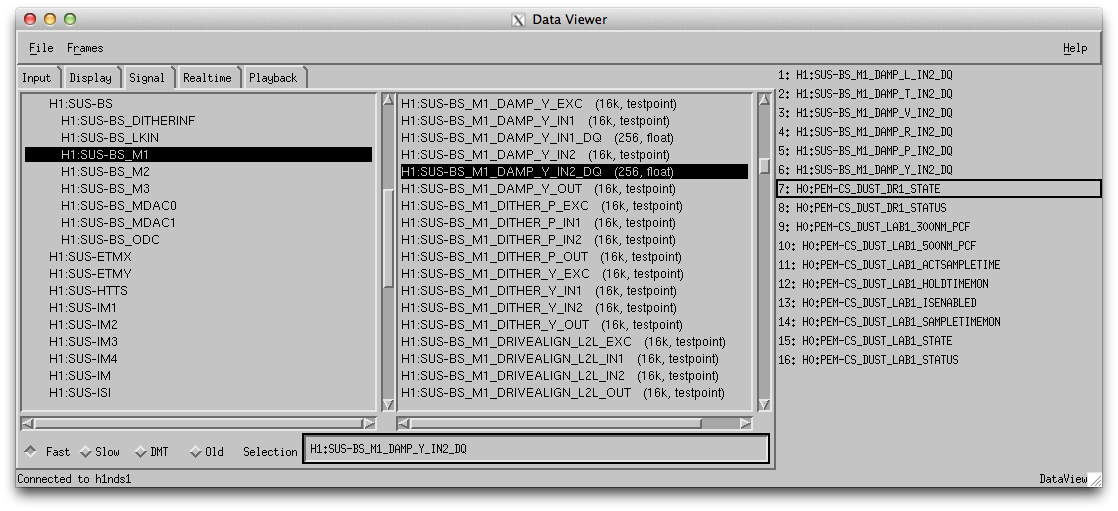
Then double click on signals to move them into the list at the right:
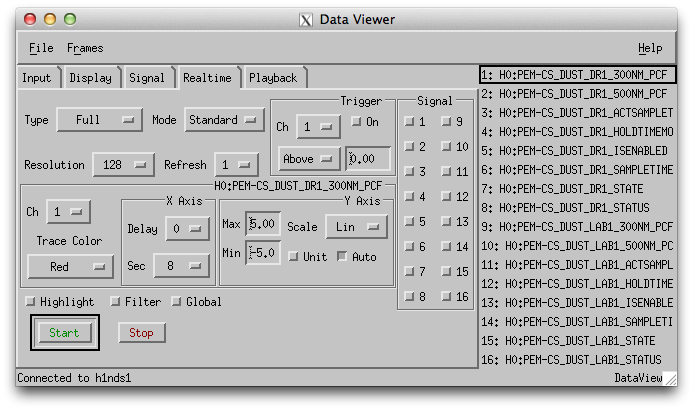
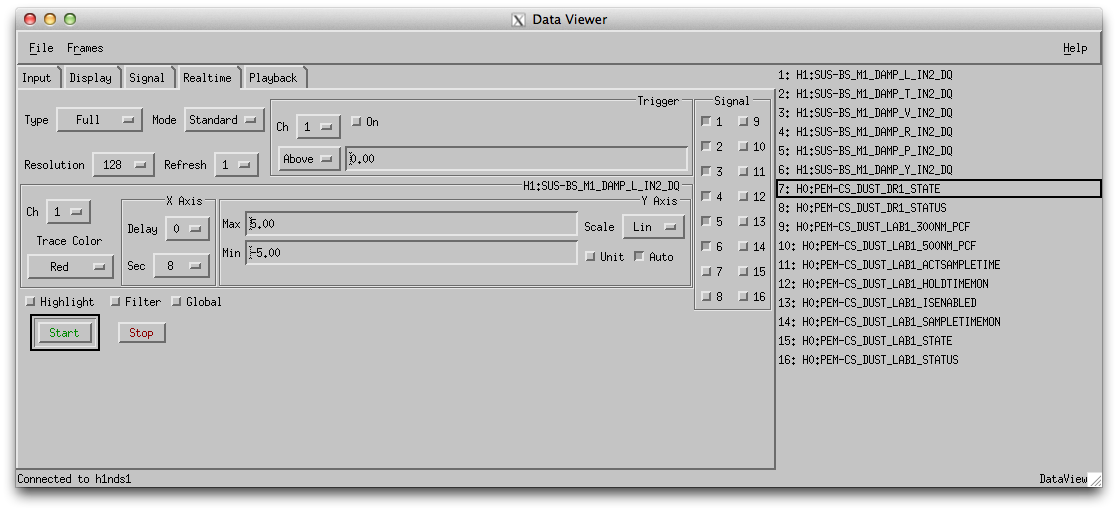
For a realtime display, return to the Realtime tab, click the corresponding buttons in the Signal group to enable the newly added signals, then click Start:
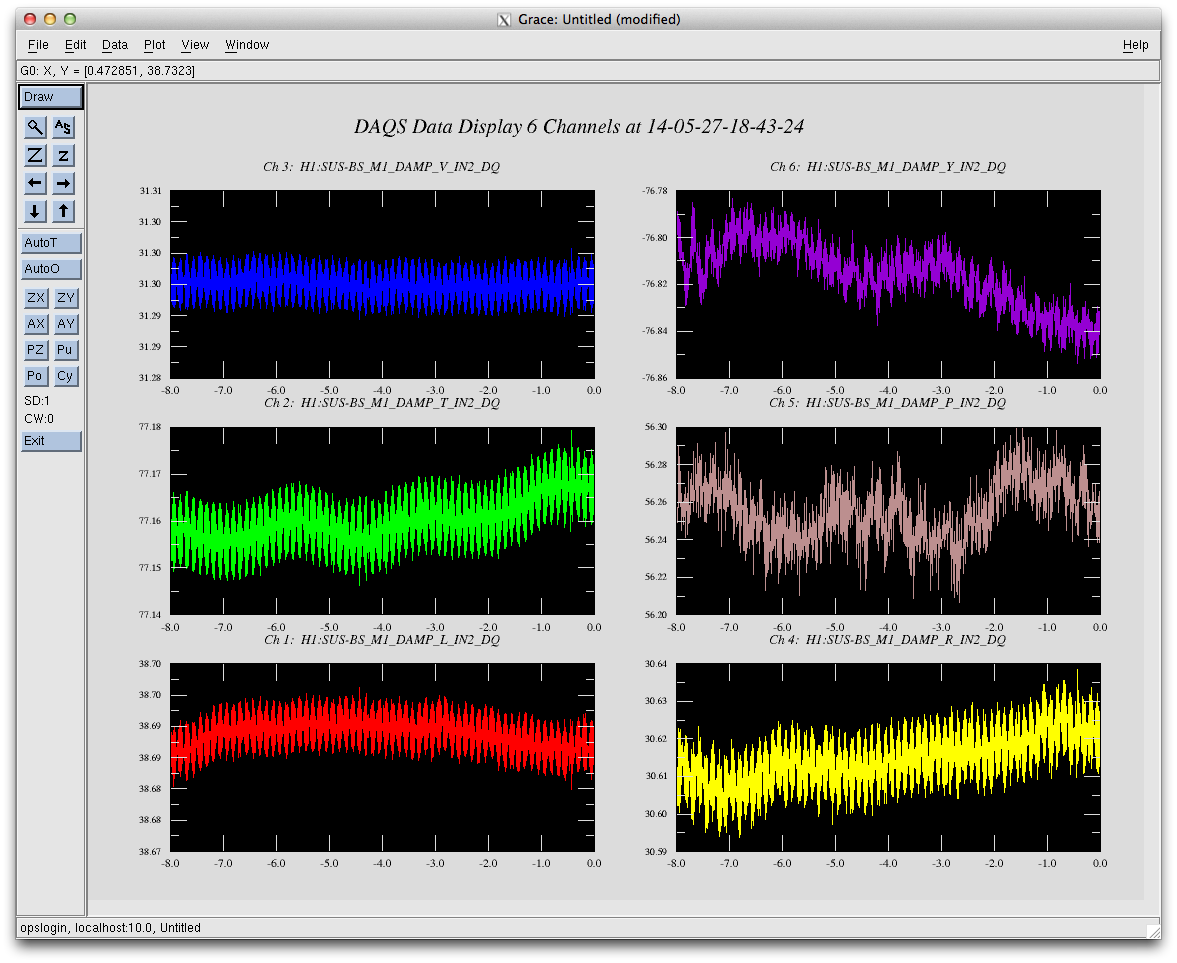
The signal graph is created with Grace and comes up in a separate window:
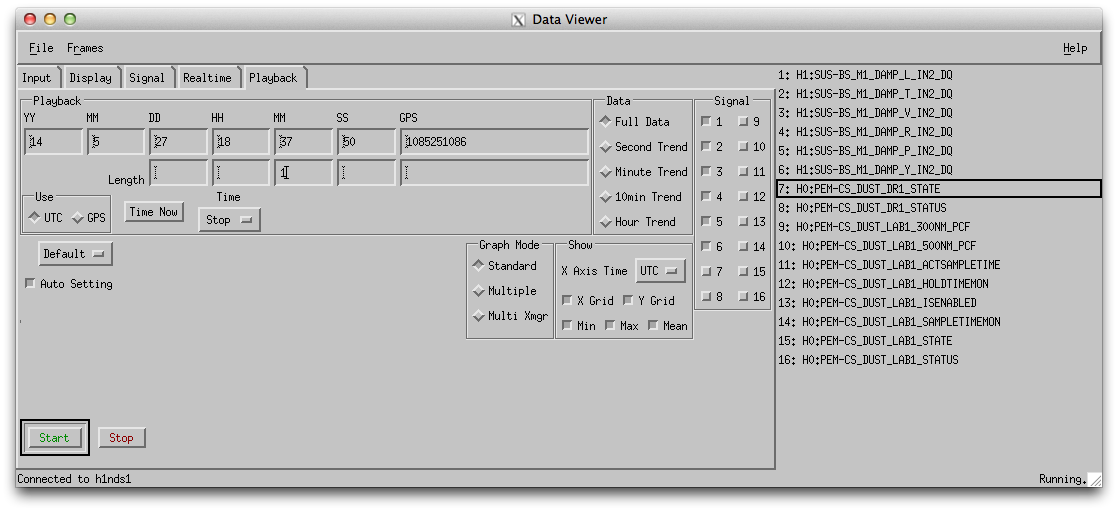
For a historical display, go to the Playback tab, click to enable the newly added signals, enter a stop time and a length, then click Start:
The Use group of radio buttons determines whether the UTC time or the GPS time is used. The Time popup determines whether the given time is interpreted as a start time or a stop time. The Time Now button copies the current time into the time fields. Note that, of "fast" channels only those ending in _DQ can be played back at full speed. For other signals, second, minute, 10-minute and hour trends are available.
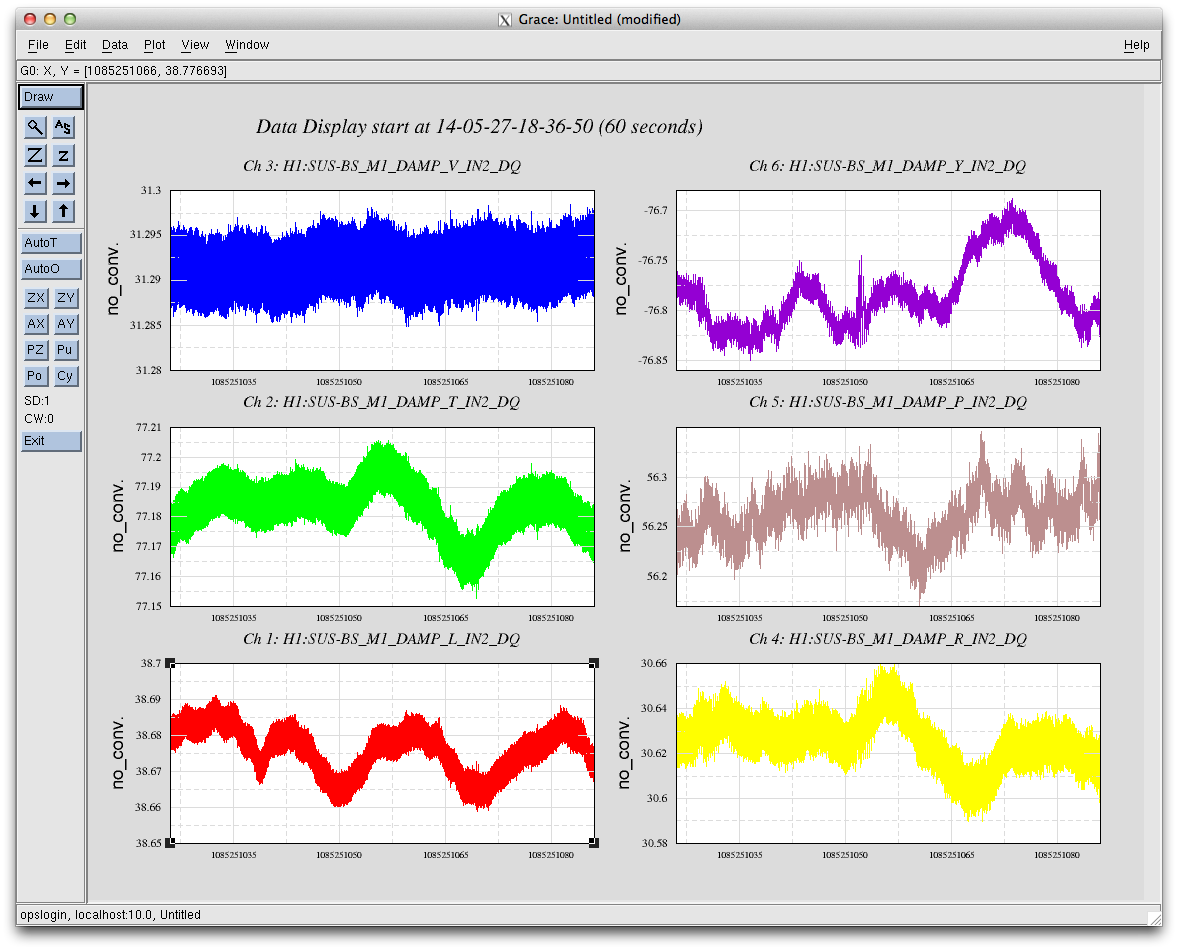
The signal graph is created with Grace and comes up in a separate window:

