2018/07/23
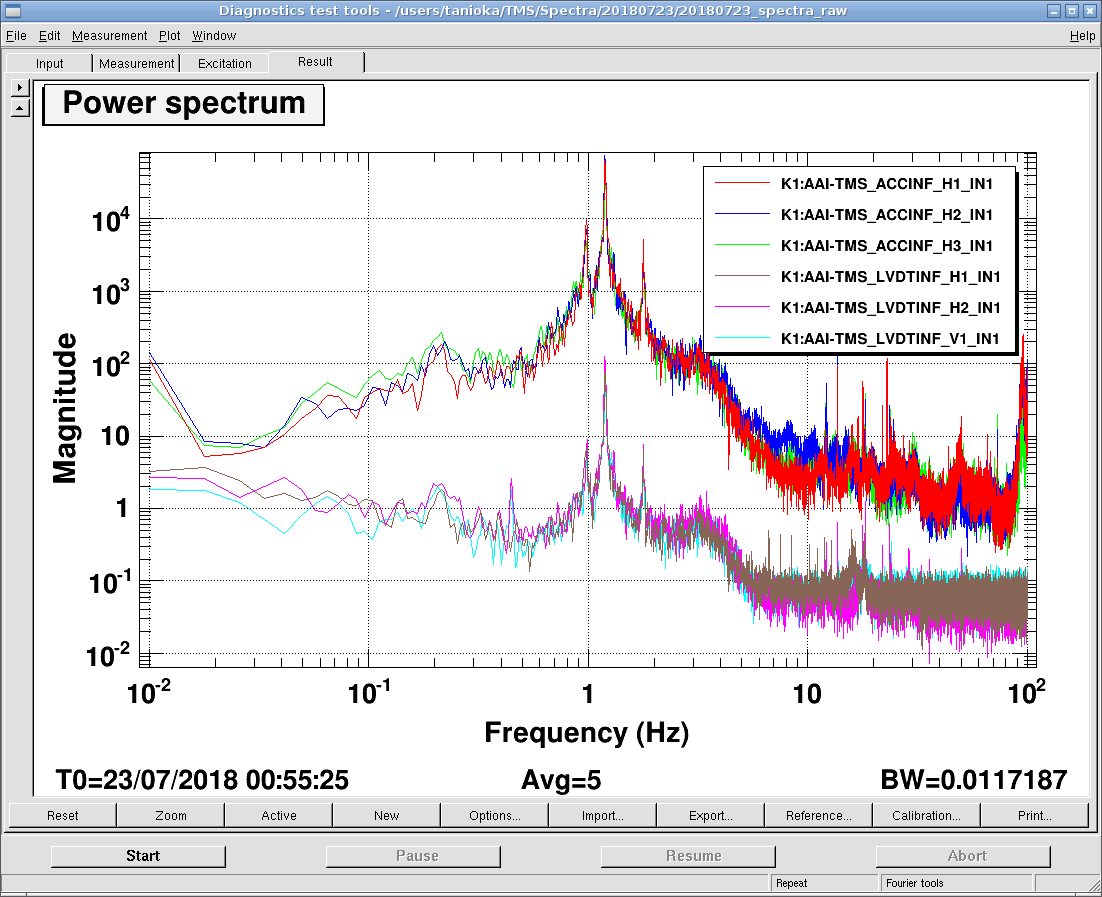
- Measured raw spectra of sensors
- The unit of vertical axis is [count] for both LVDTs and Geophones
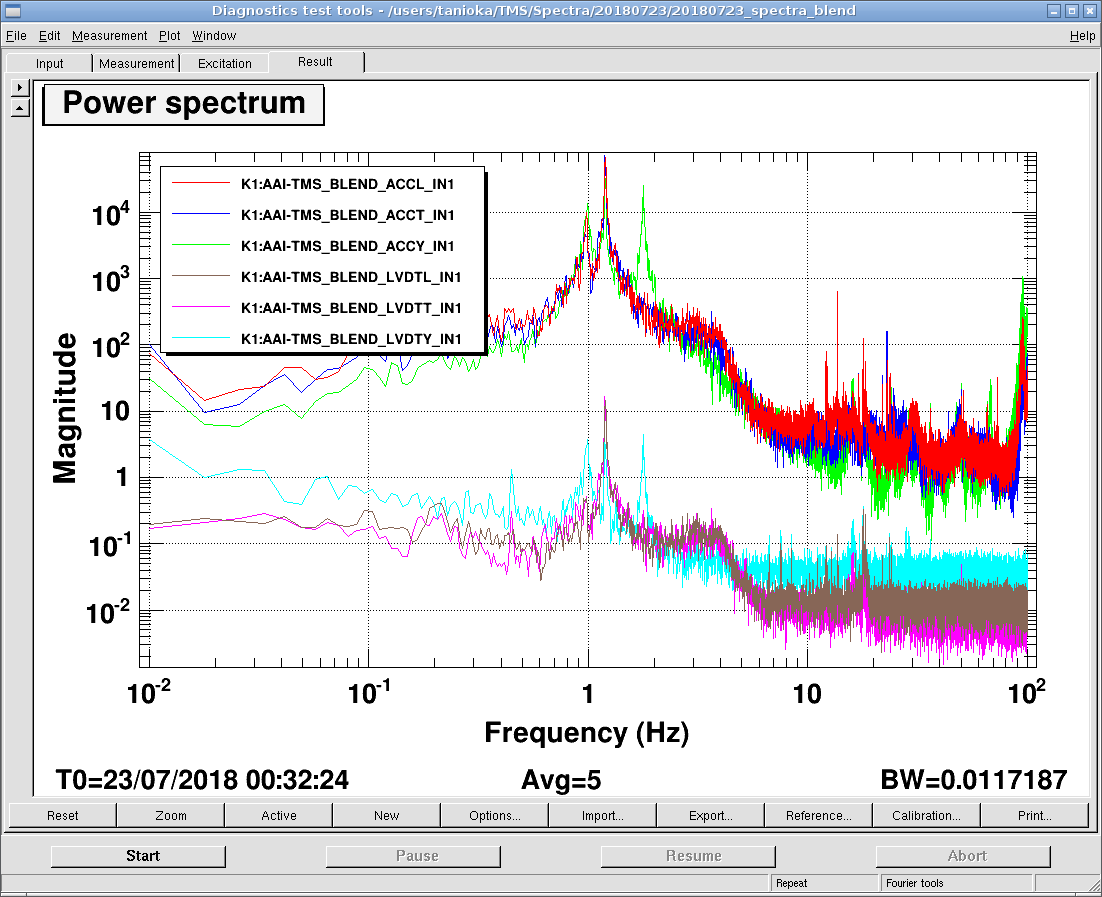
- diagonalized one (not perfect yet)
- The units of vertical axis are [um] for LVDTs and [count] for Geophones
- H3 LVDT was connected to the V1 port temporary.
This is because the H3 channel of the LVDT driver got broken at some point (klog).
- もともとはH3にH3のLVDTを接続していたが、LVDT driverの不具合により、信号が見えなかった。そのため、temporaryにV1のCHにH3 LVDTを繋いで信号をとることにした。
- 上のklogのリンクを参照。
- 今回、V1につないでいたH3 LVDTのケーブルをH4(CH7)に繋ぎ変えて、LVDTのHorizontalとVertical全ての信号を見られるようにした。
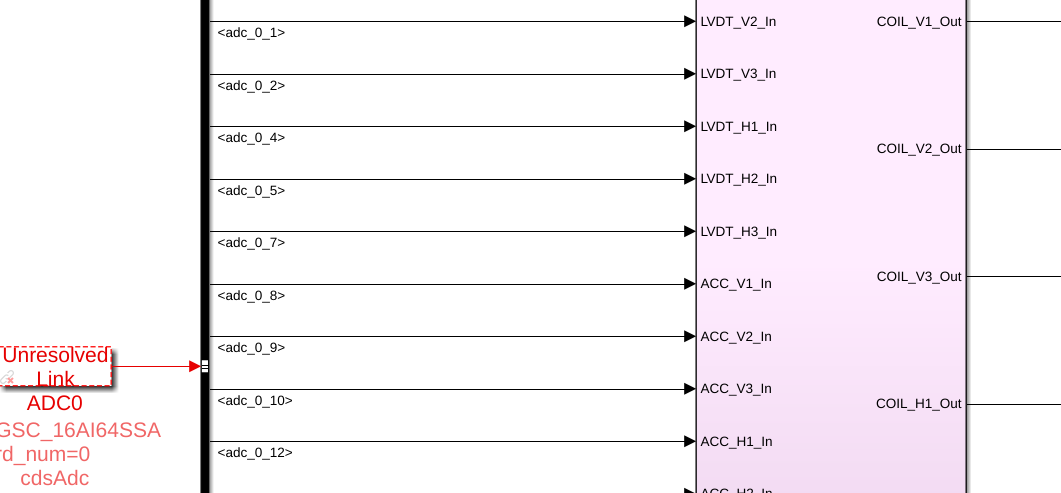
- Today, we changed H3 LVDT connection port from V1 to H4 (CH7).
- Then we modified the model and can measure the H3 LVDT signal.
- As the below figure, adc_0_7 (signal from H3 LVDT) is now connected to LVDT_H3_In.
- We measured spectra of LVDTs both vertical and horizontal.
- The upper figure shows vertical spectra and the lower one shows horizontal.
- The units of vertical axis are both count.
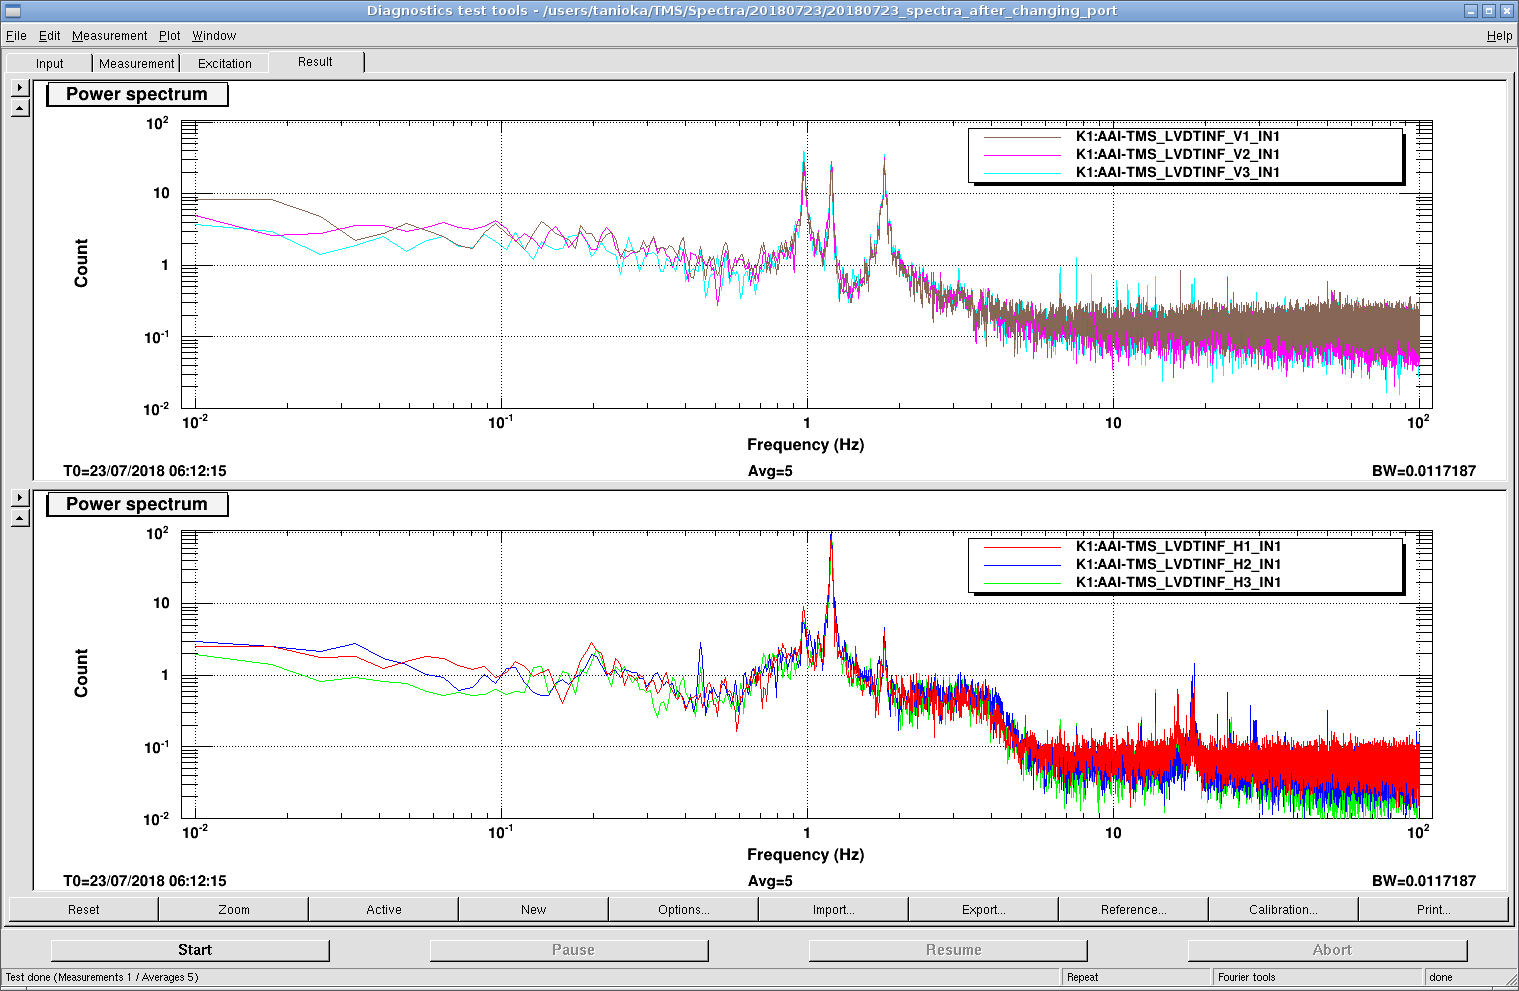
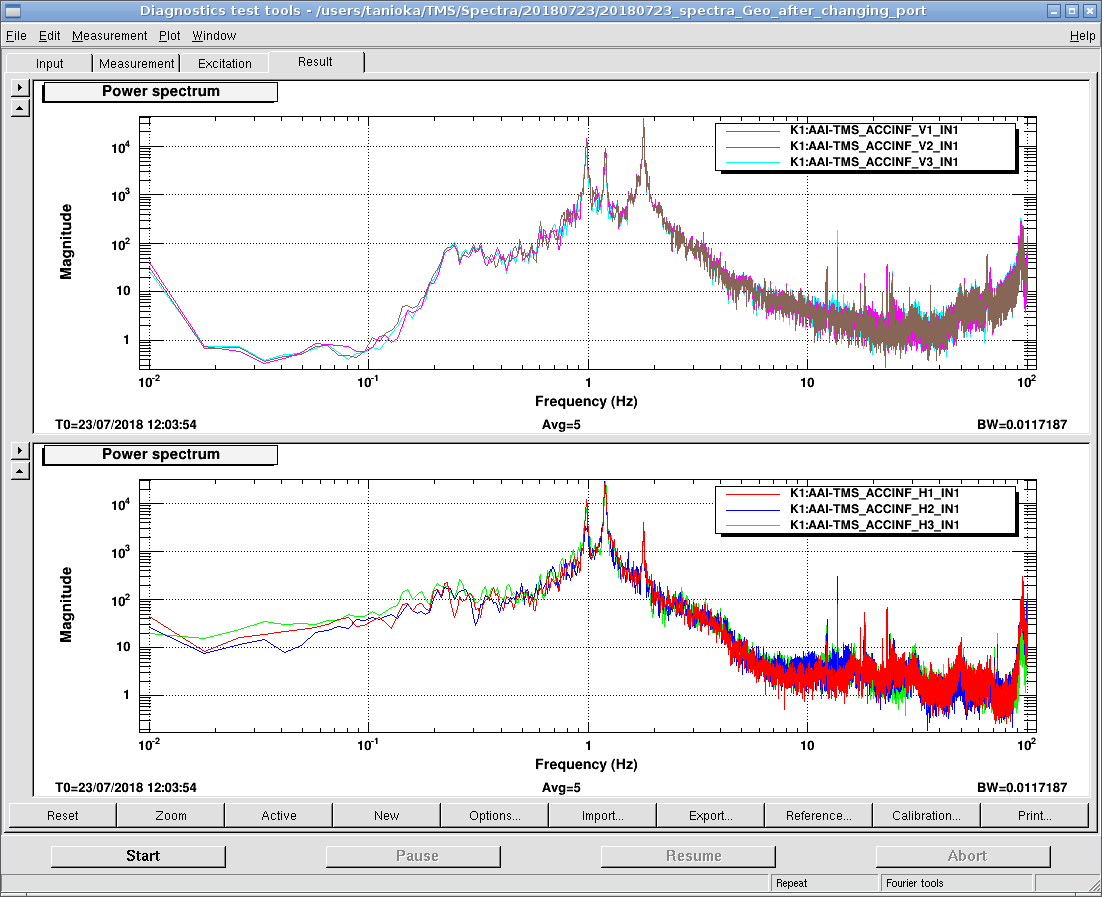
- We can see three peaks around 0.98 Hz, 1.3 Hz and 1.8 Hz.
- The peak at 1.3 Hz seems the coupling from horizontal (L and T).
- To investigate the peak, we measured TFs using white-noise from 0.01 Hz to 10 Hz (BW=0.01 Hz).
- When we measured TFs, we adopted the filters which calibrate Geophone response and output signal as velocity.
- This filter should be determined by each Geophone parameters, but we used same filters to each Geophone temporary.
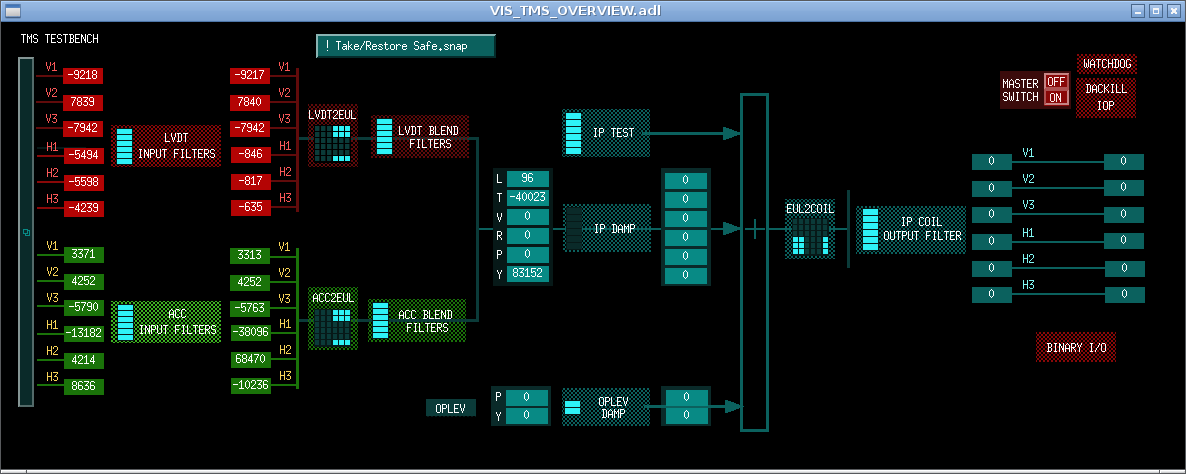
- The below figure shows the TFs when we excite Y direction.
- The excitation signal was injected at IP TEST in the above MEDM picture.
- The legends are shown in the graph of coherence.
- 下の図は各伝達関数とcoherenceのグラフである。
- 左上の図はGainを表しており、excitaionとLVDTあるいはGeohoneからのcalibrateされた信号との比を取っていることから、単位はLVDTに関してはum/cnt、Geophoneは(um/s)/cntとした。
- なお、Geophoneの信号には速度に変換するcalibrataion filterがかけられている。
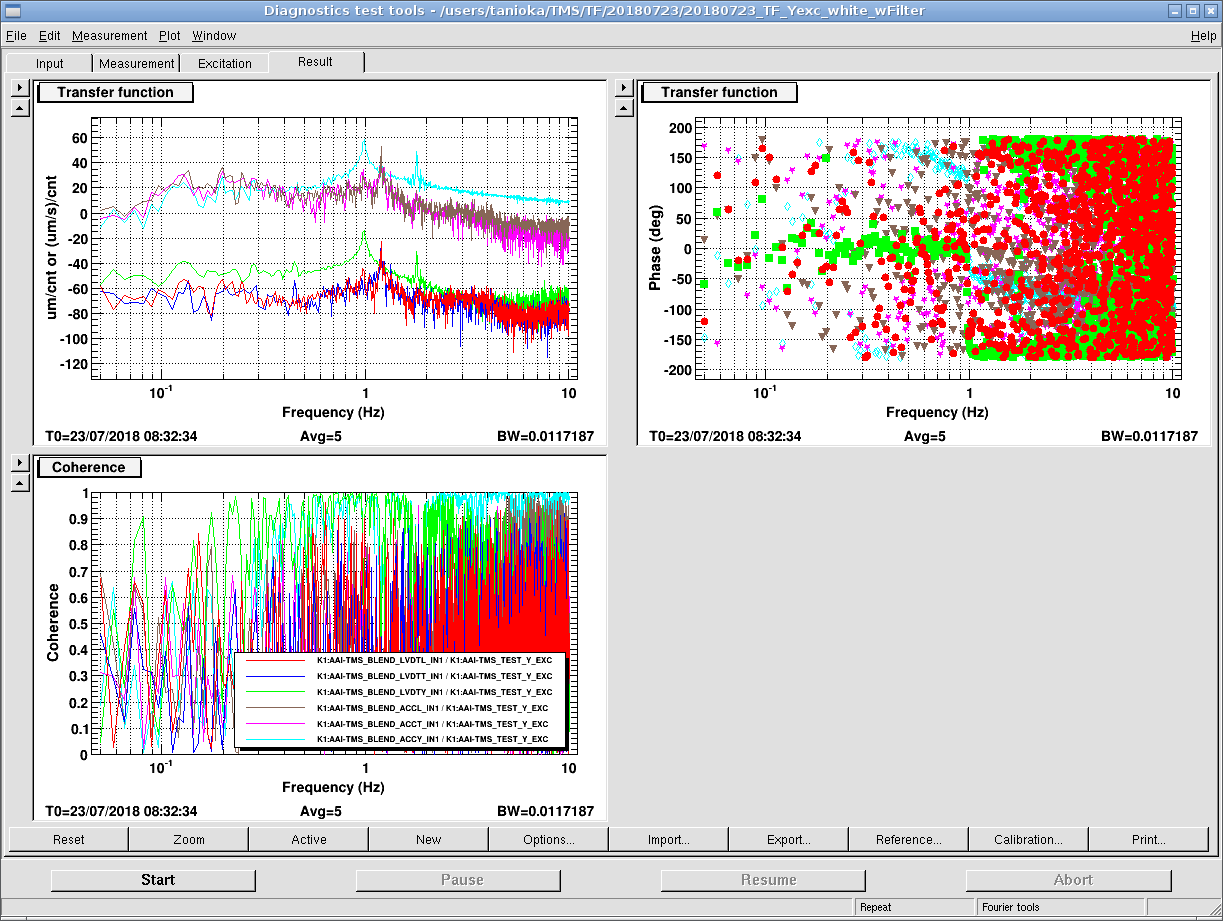
- There are 2 peaks around 0.98 Hz and 1.8 Hz in Y direction TFs (both Geophone and LVDT).
- These peaks are derived from Y direction resonance.
- The peak around 1.3 Hz seems come from horizontal resonance.
- Also Uraguchi-san provided us measured data.
- Need to analyze the.
note
- So far, we connected H3 LVDT to V1 port.
- Today, we changed H3 LVDT connection port from V1 to H4 (CH7).
- Then we modified the model and now we can monitor all LVDT signals.
- When connecting H3 LVDT, we adjusted the trimmer of LVDT driver.
- When we modified the model, the path did not exist. So we run the file "startup.m" and made a path.
- The matrices were temporary changed due to the H3 port problem, but now the matrices are correct.
Changing LVDT channel
- We changed LVDT channel from V1 (CH0) to H4 (CH7).
- At first, we connected to H1 (CH4) port to know how large counts the LVDT output.
- It was about -4200 cnt.
- Then connected to H4 port.
- After that, the output was about -500 cnt.
- So we calibrated by changing phase and gain.
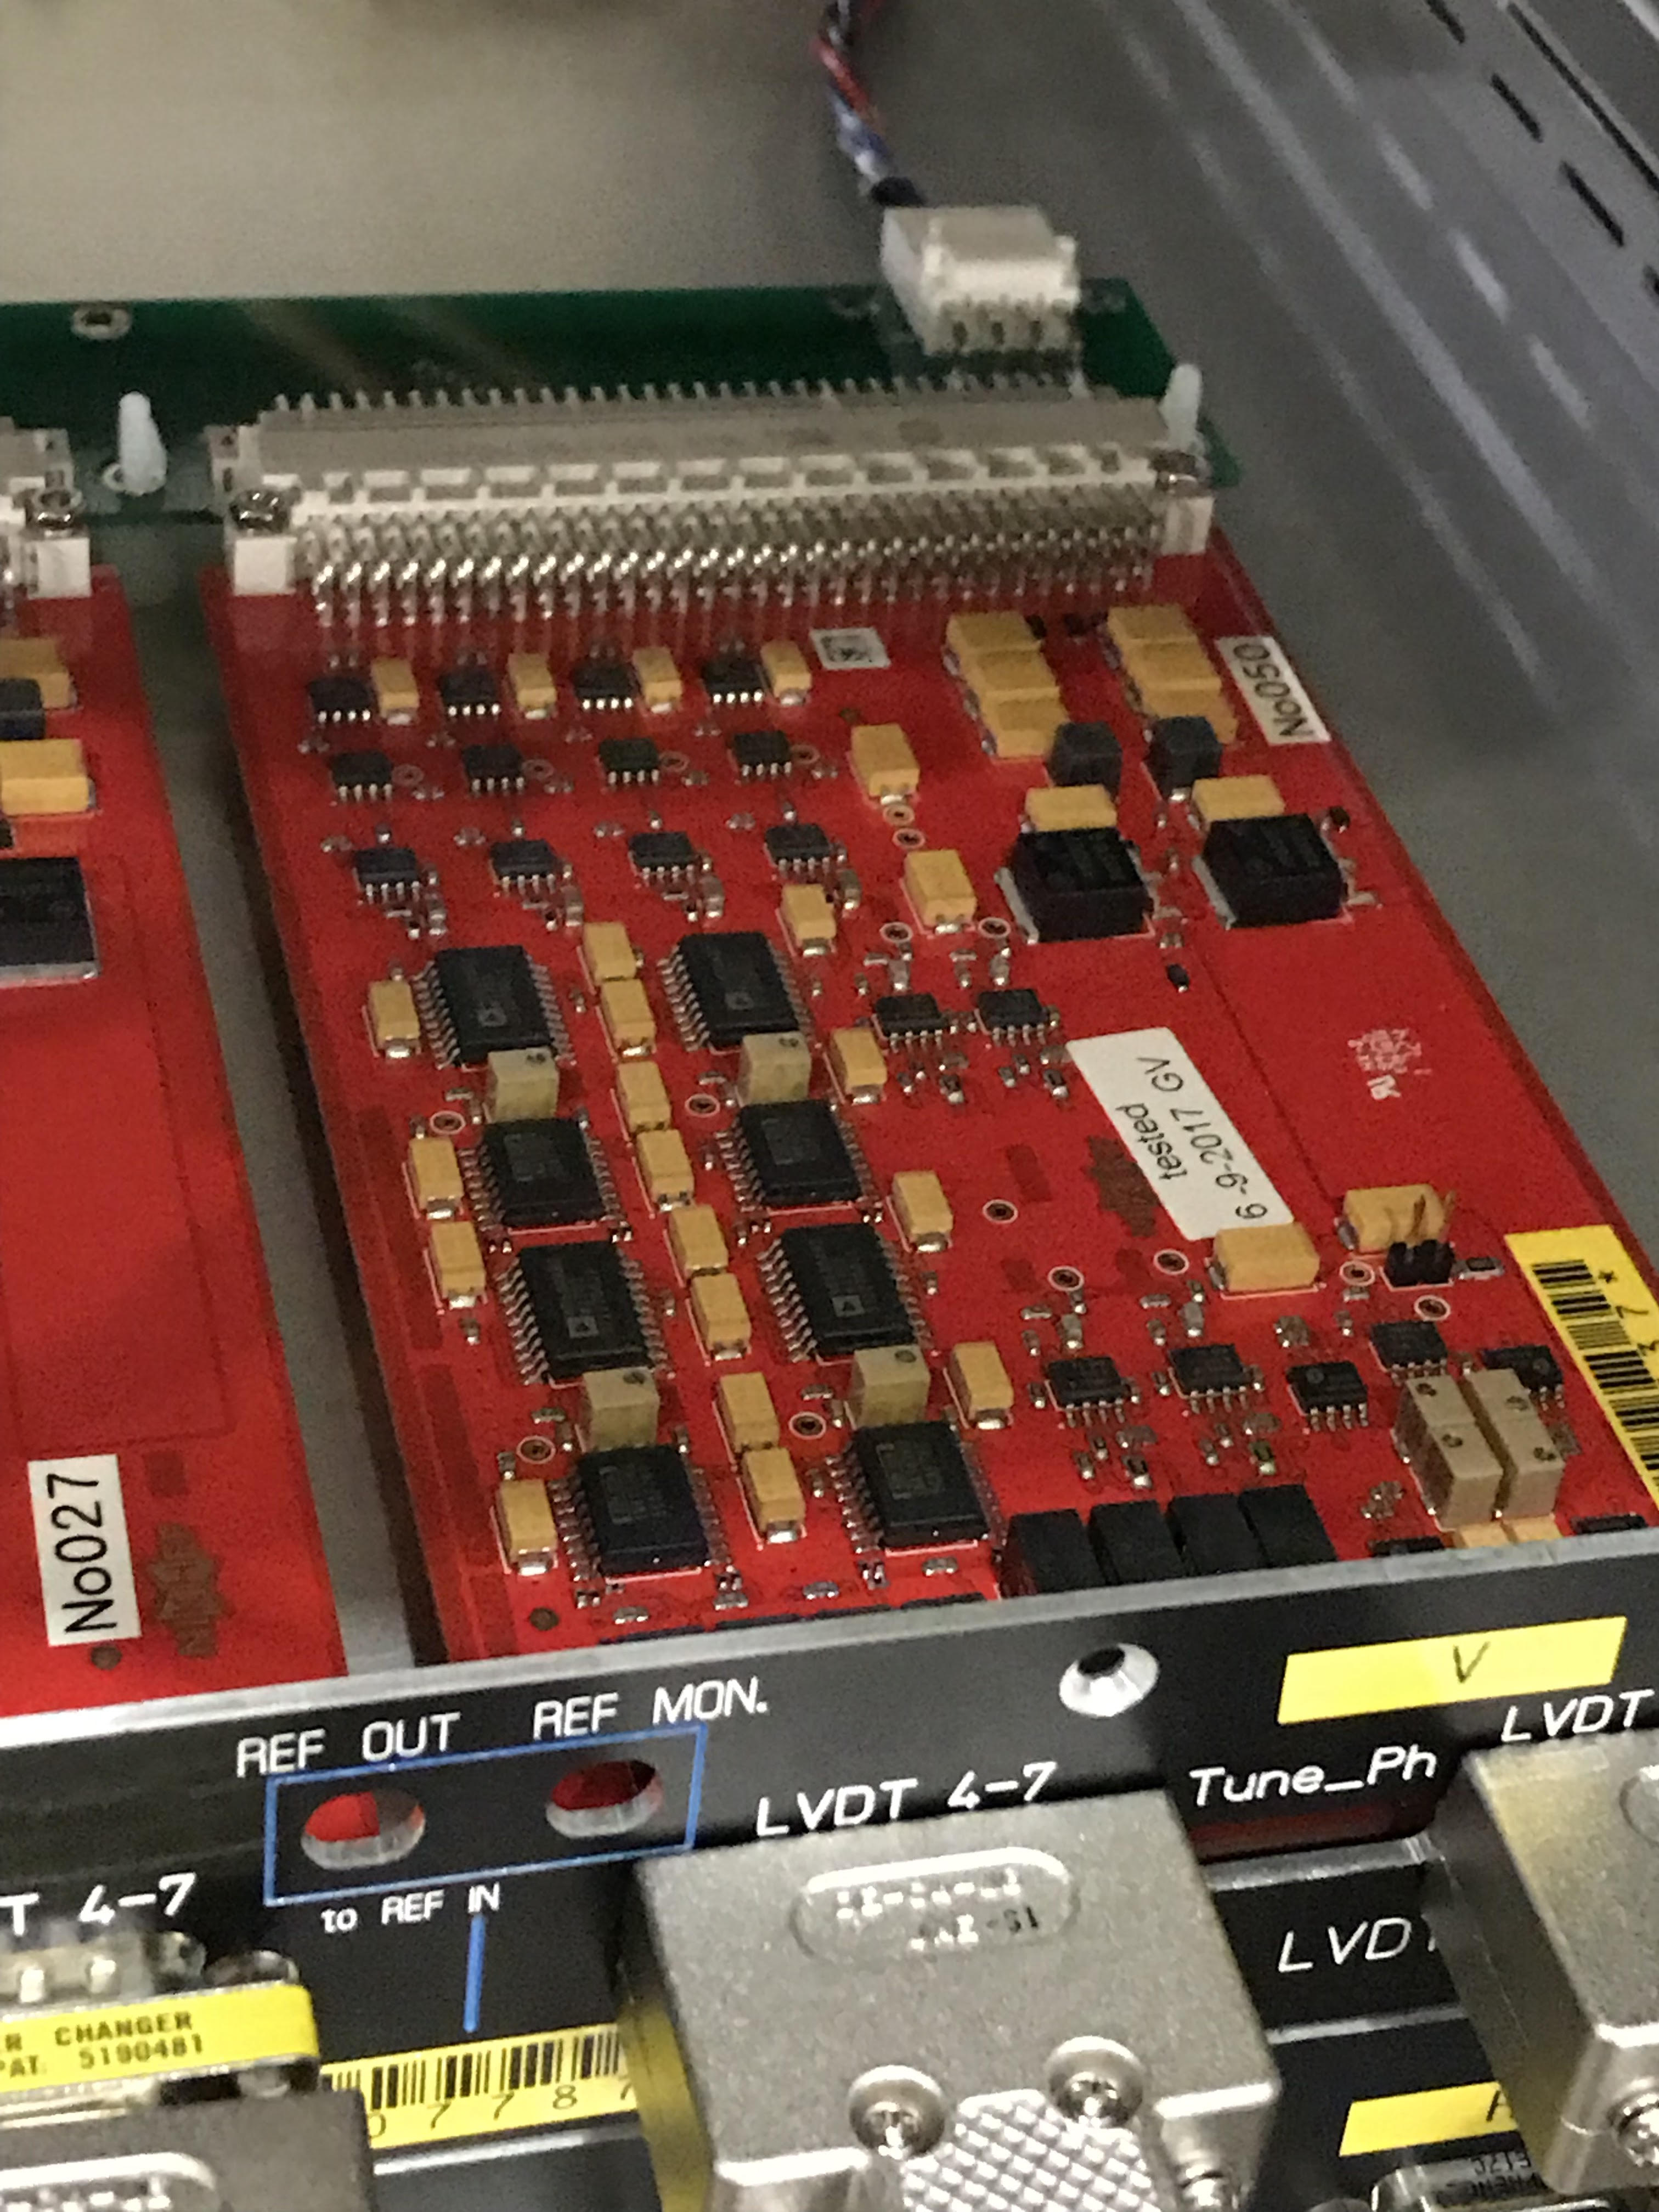
- First, we modified the phase by tuning (see below picture) with monitoring output and adjusted at the point that the output count was minimum.
- まず、H1 LVDTが差さっていたCH4にH3 LVDTをつないで、すでにcalibrateされたチャンネルでのカウント数がどの程度か確認した。カウント数は-4200であり、このカウントになるようにphaseとgainを調整する。
- 次にH4 (CH7)にH3 LVDTを繋ぎ変えてカウント数を見たところ、カウント数は-500であった。-500から-4200カウントになるように調整していく。
- まず、phaseの調整を行った。これは下の写真でD subコネクターの間にある銀色のトリマー(?)を回してphaseを調整する。一番右のトリマーが4つ目のチャンネルに対応する。-4200 cntに近づくようにphaseを調整していくと、途中でカウント数が減少から増加に転じる位置がある。このpointにphaseを設定する。ここで -3000 cnt程度であった。
- 次にgainを調整することで-4200 cntに合わせる。gainは一番下の写真の回路上で左下半分の領域にある4つのトリマーのうちの1つを回して調整する。
一連のcalibration中はStripToolでカウント数を確認しながら調整を行う。
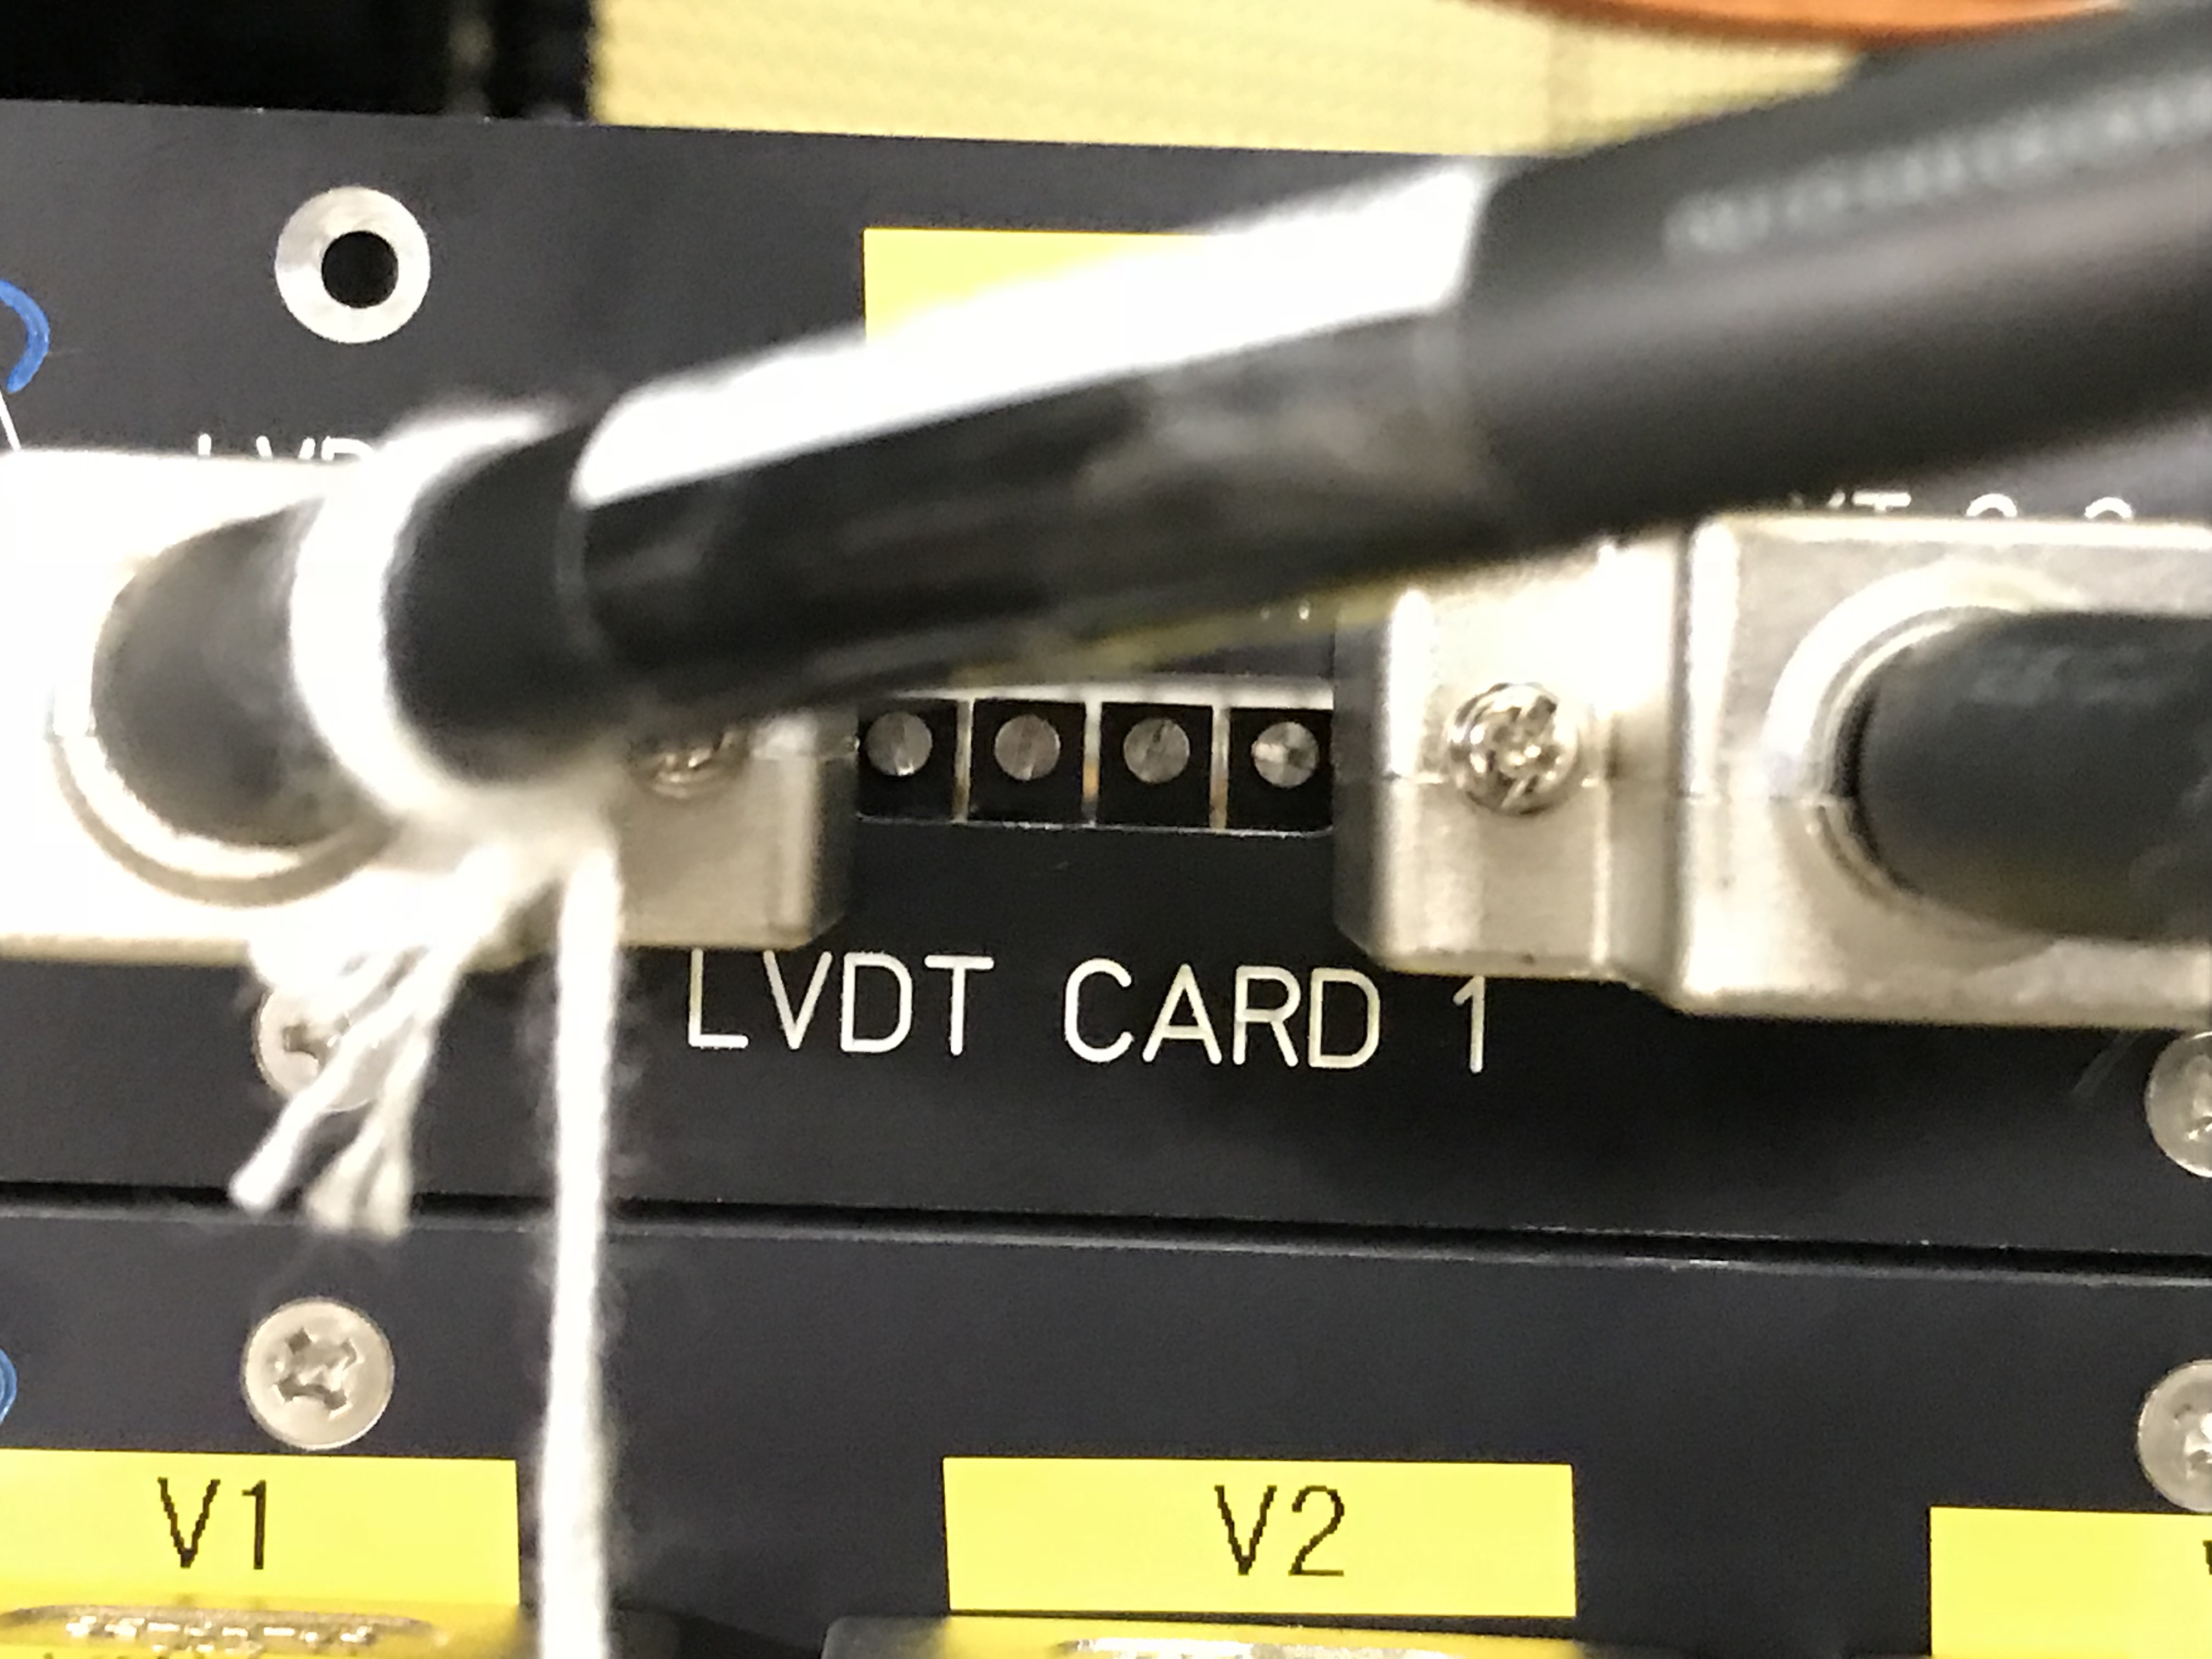
- Then, we changed the gain to adjust the count to -4200.
1 |
3 |
2 |
4 |
- Corresponding trimmer assignment is like this.
- Trimmerの配置は左上から左下に1,2、右上から右下に3,4と並んでいる。
